Great post by Tony Heller
https://realclimatescience.com/2019/02/extreme-wildfire-fraud-in-the-national-climate-assessment/
Extreme Wildfire Fraud In The National Climate Assessment
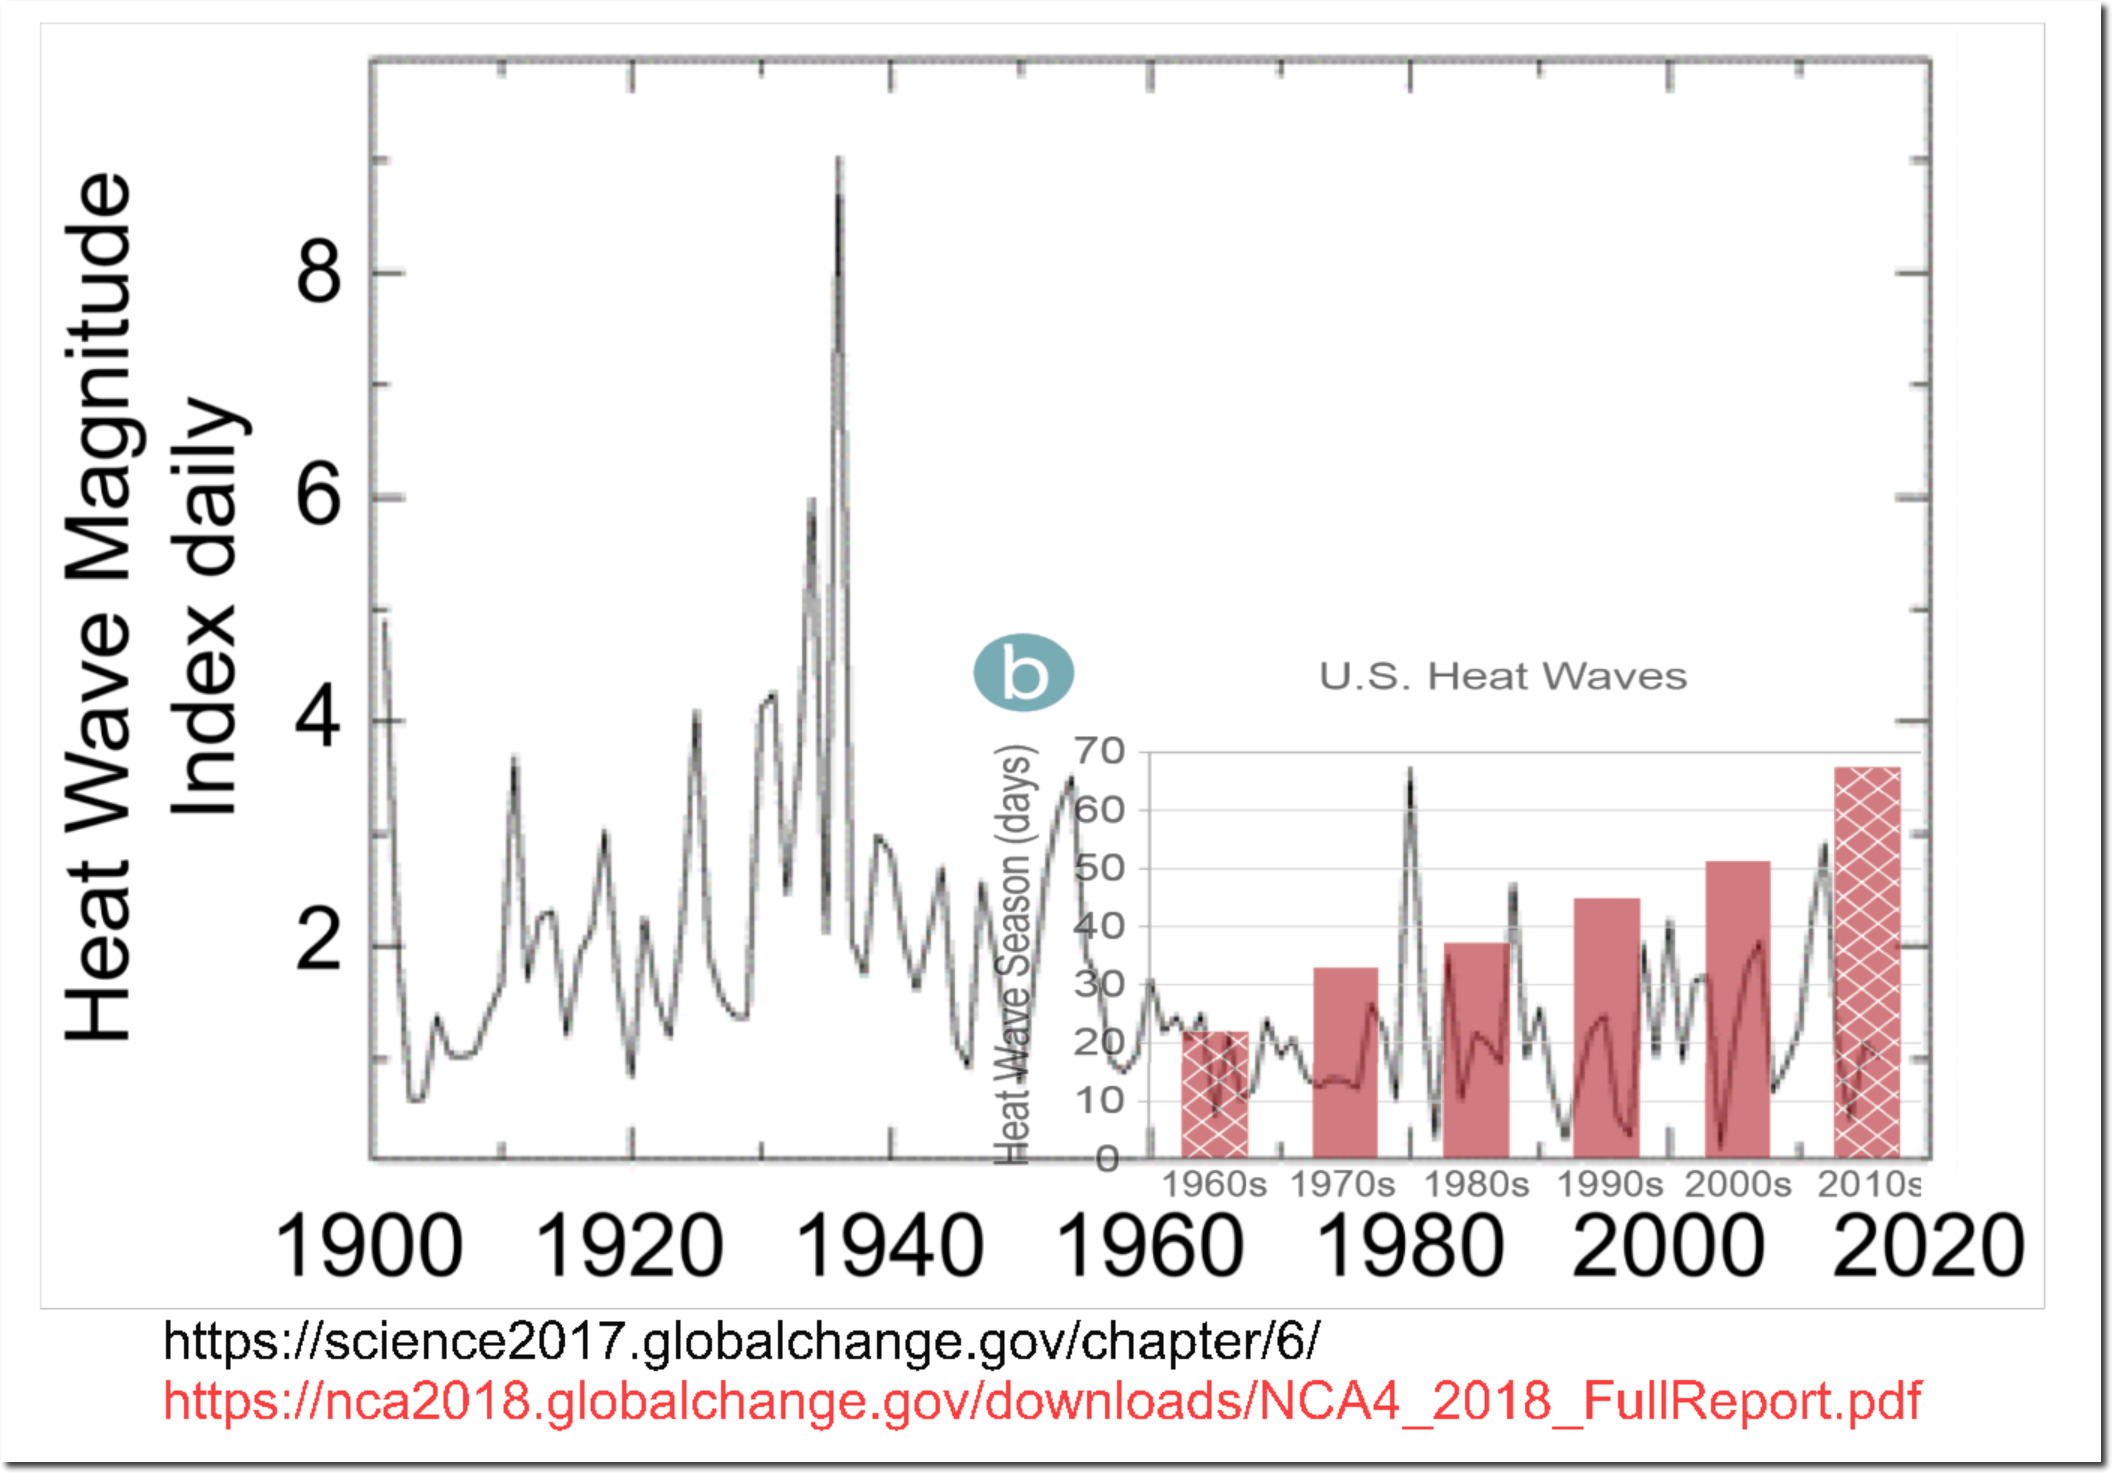
Yesterday I showed how the National Climate Assessment is committing blatant fraud about heat waves, by hiding the data which shows their claims are inverted from reality.
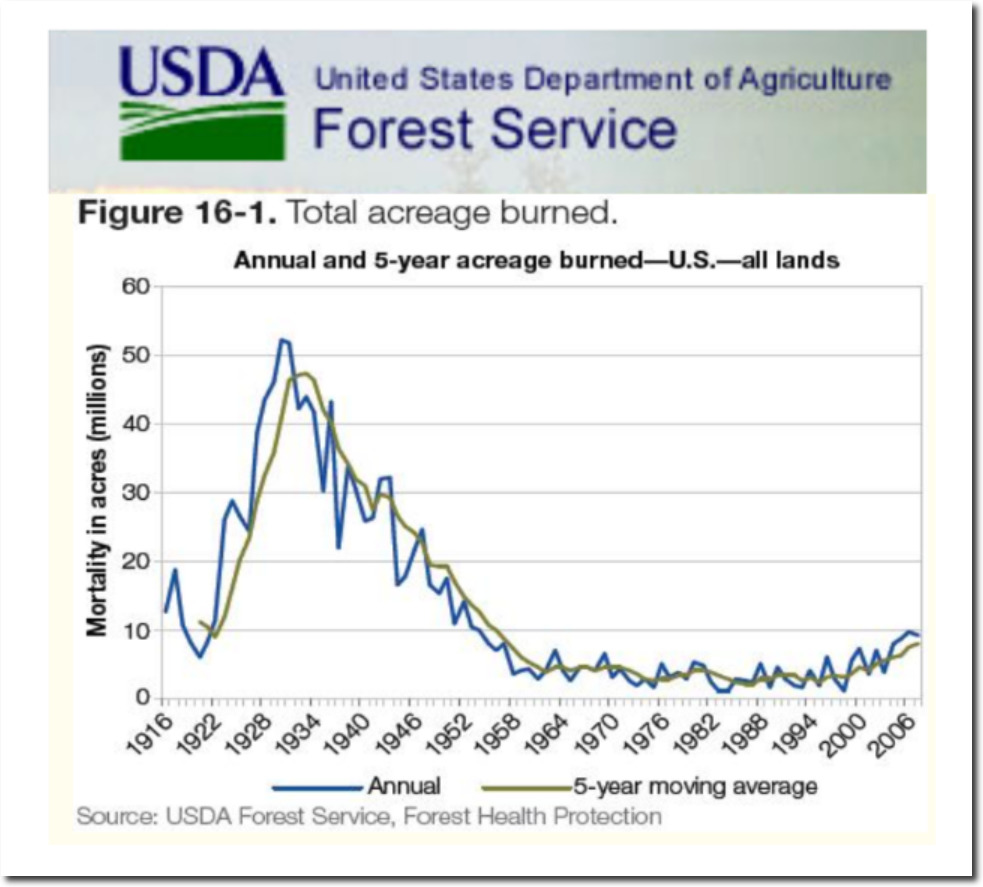
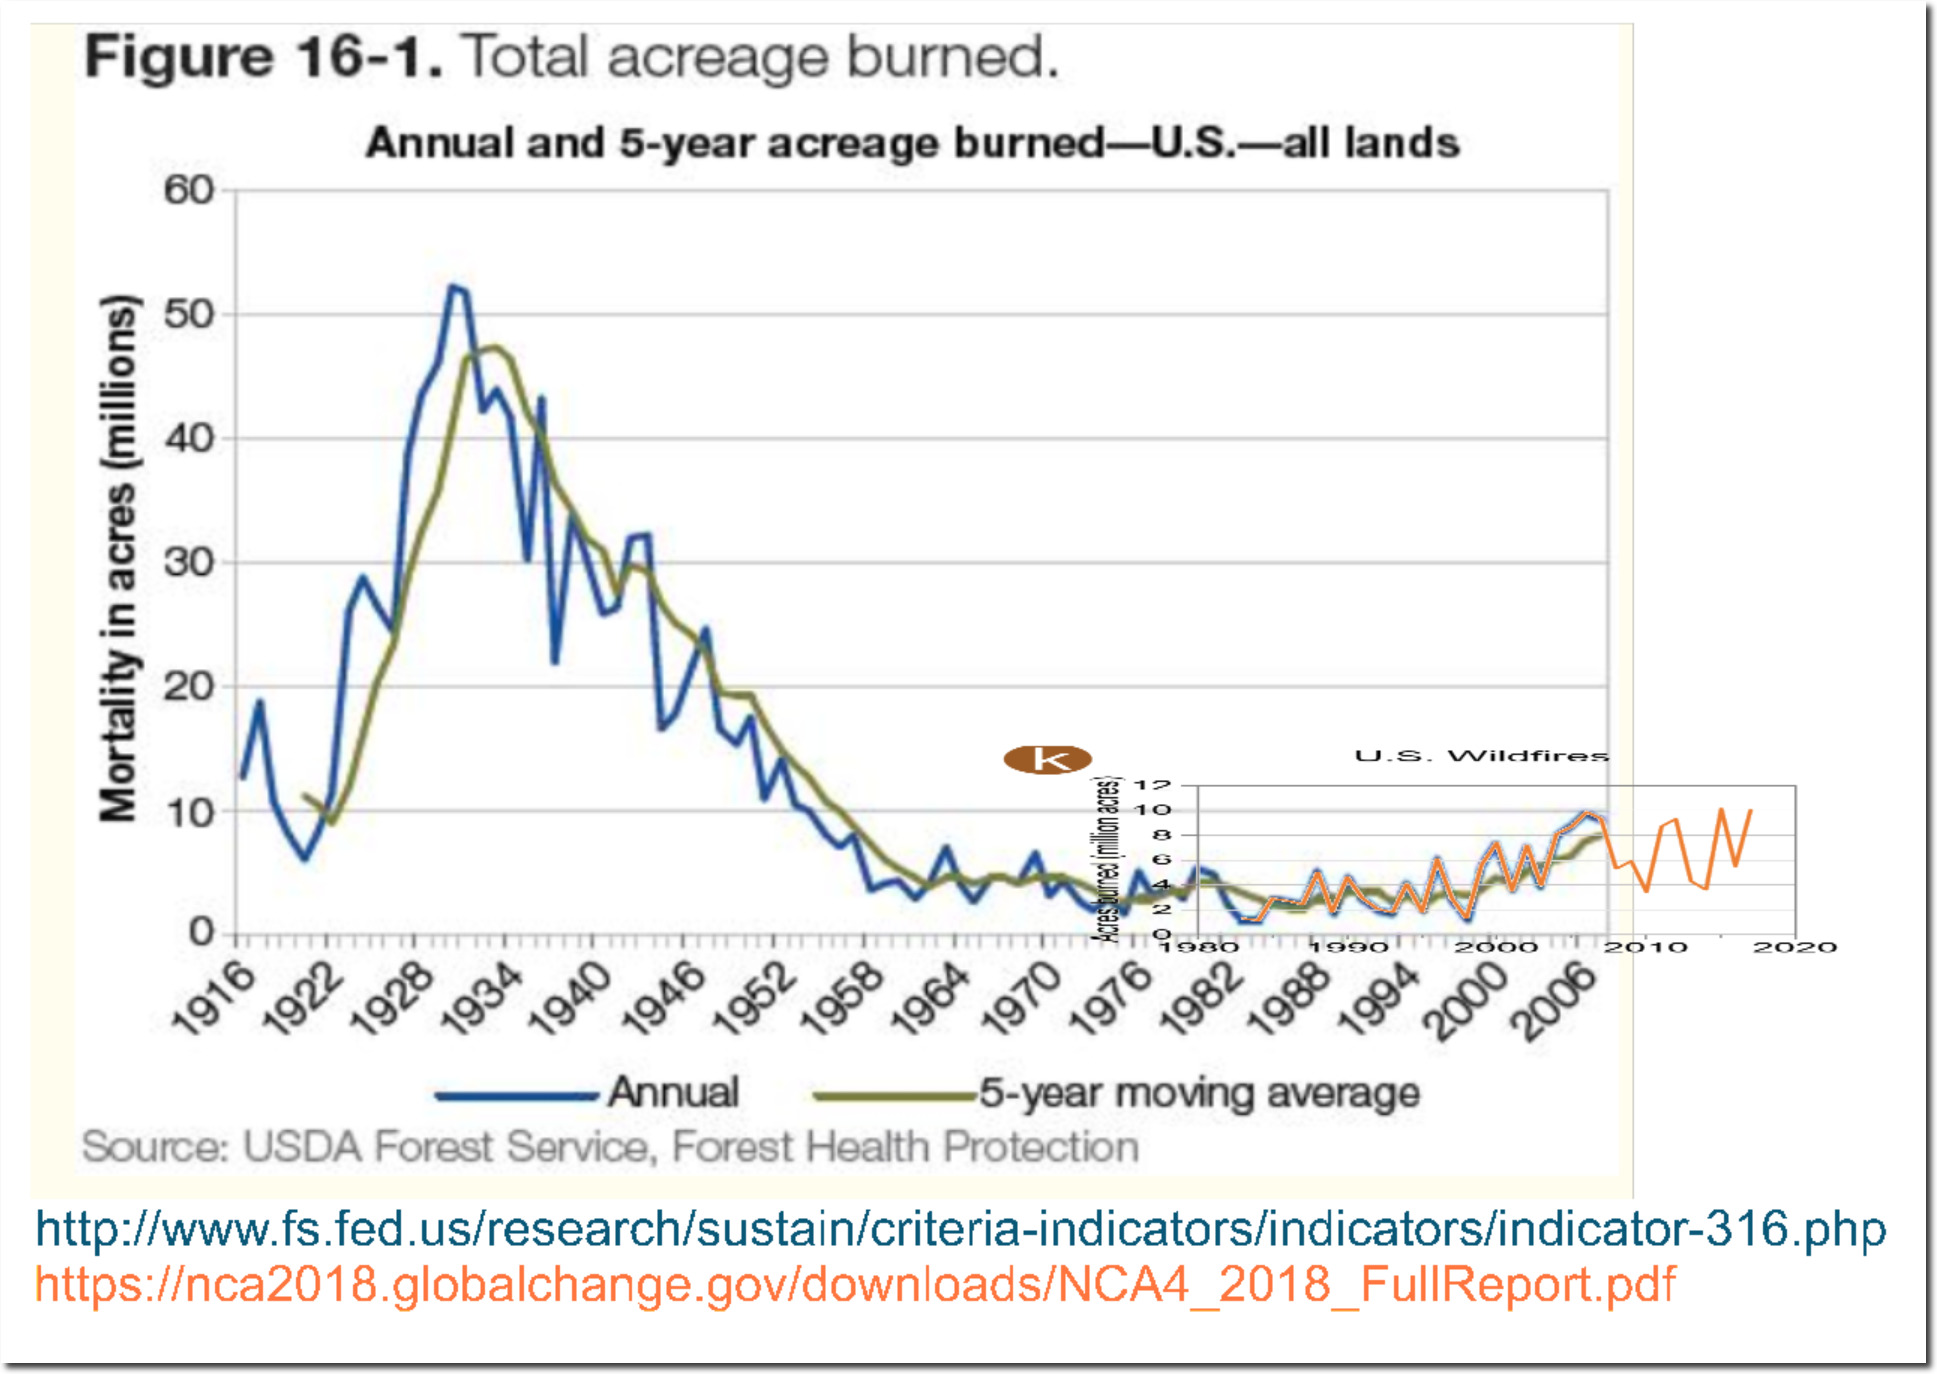
In this post, I show how they are doing exactly the same thing with wildfires. They show US burn acreage rapidly increasing.
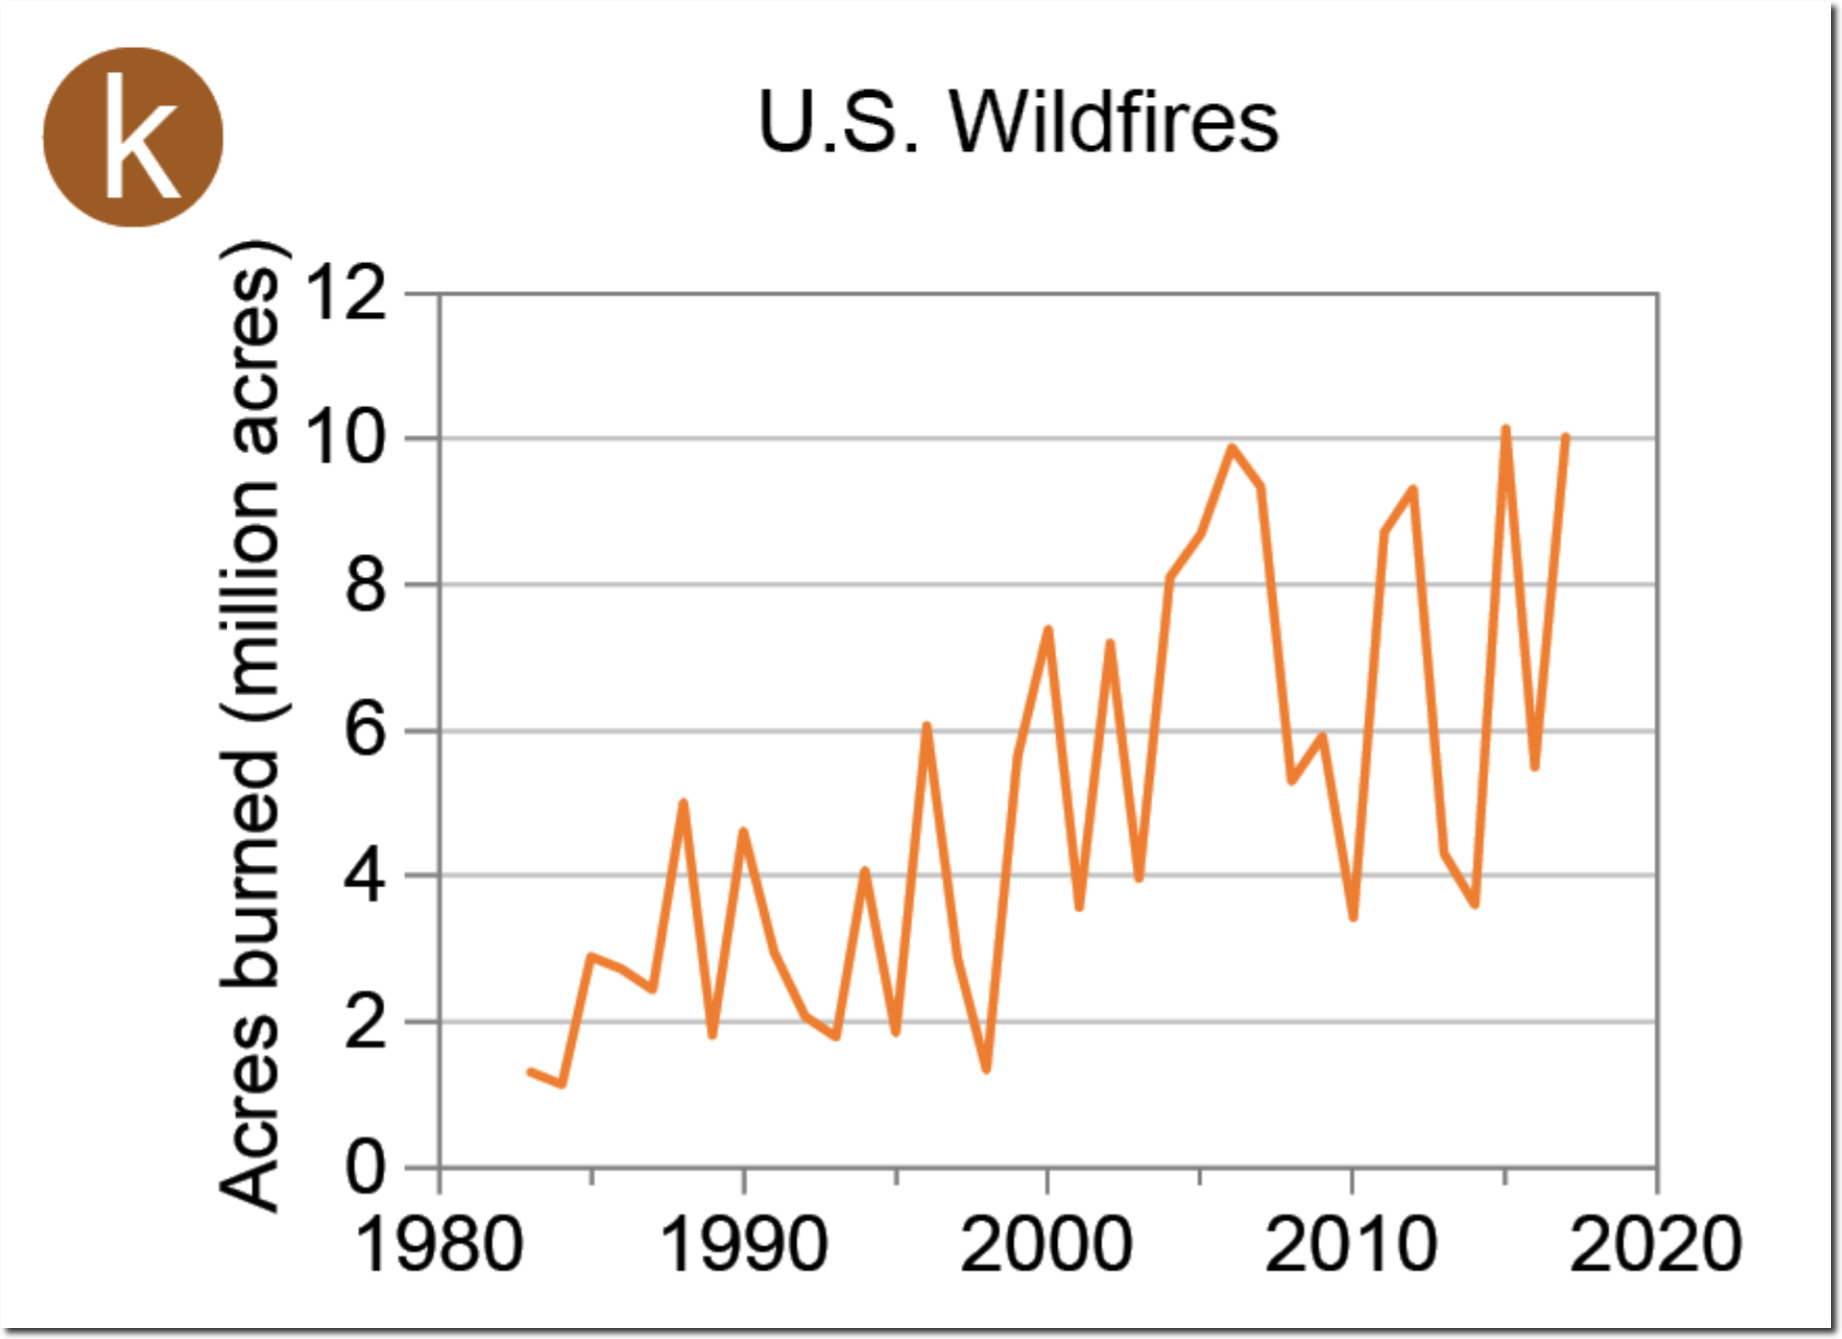
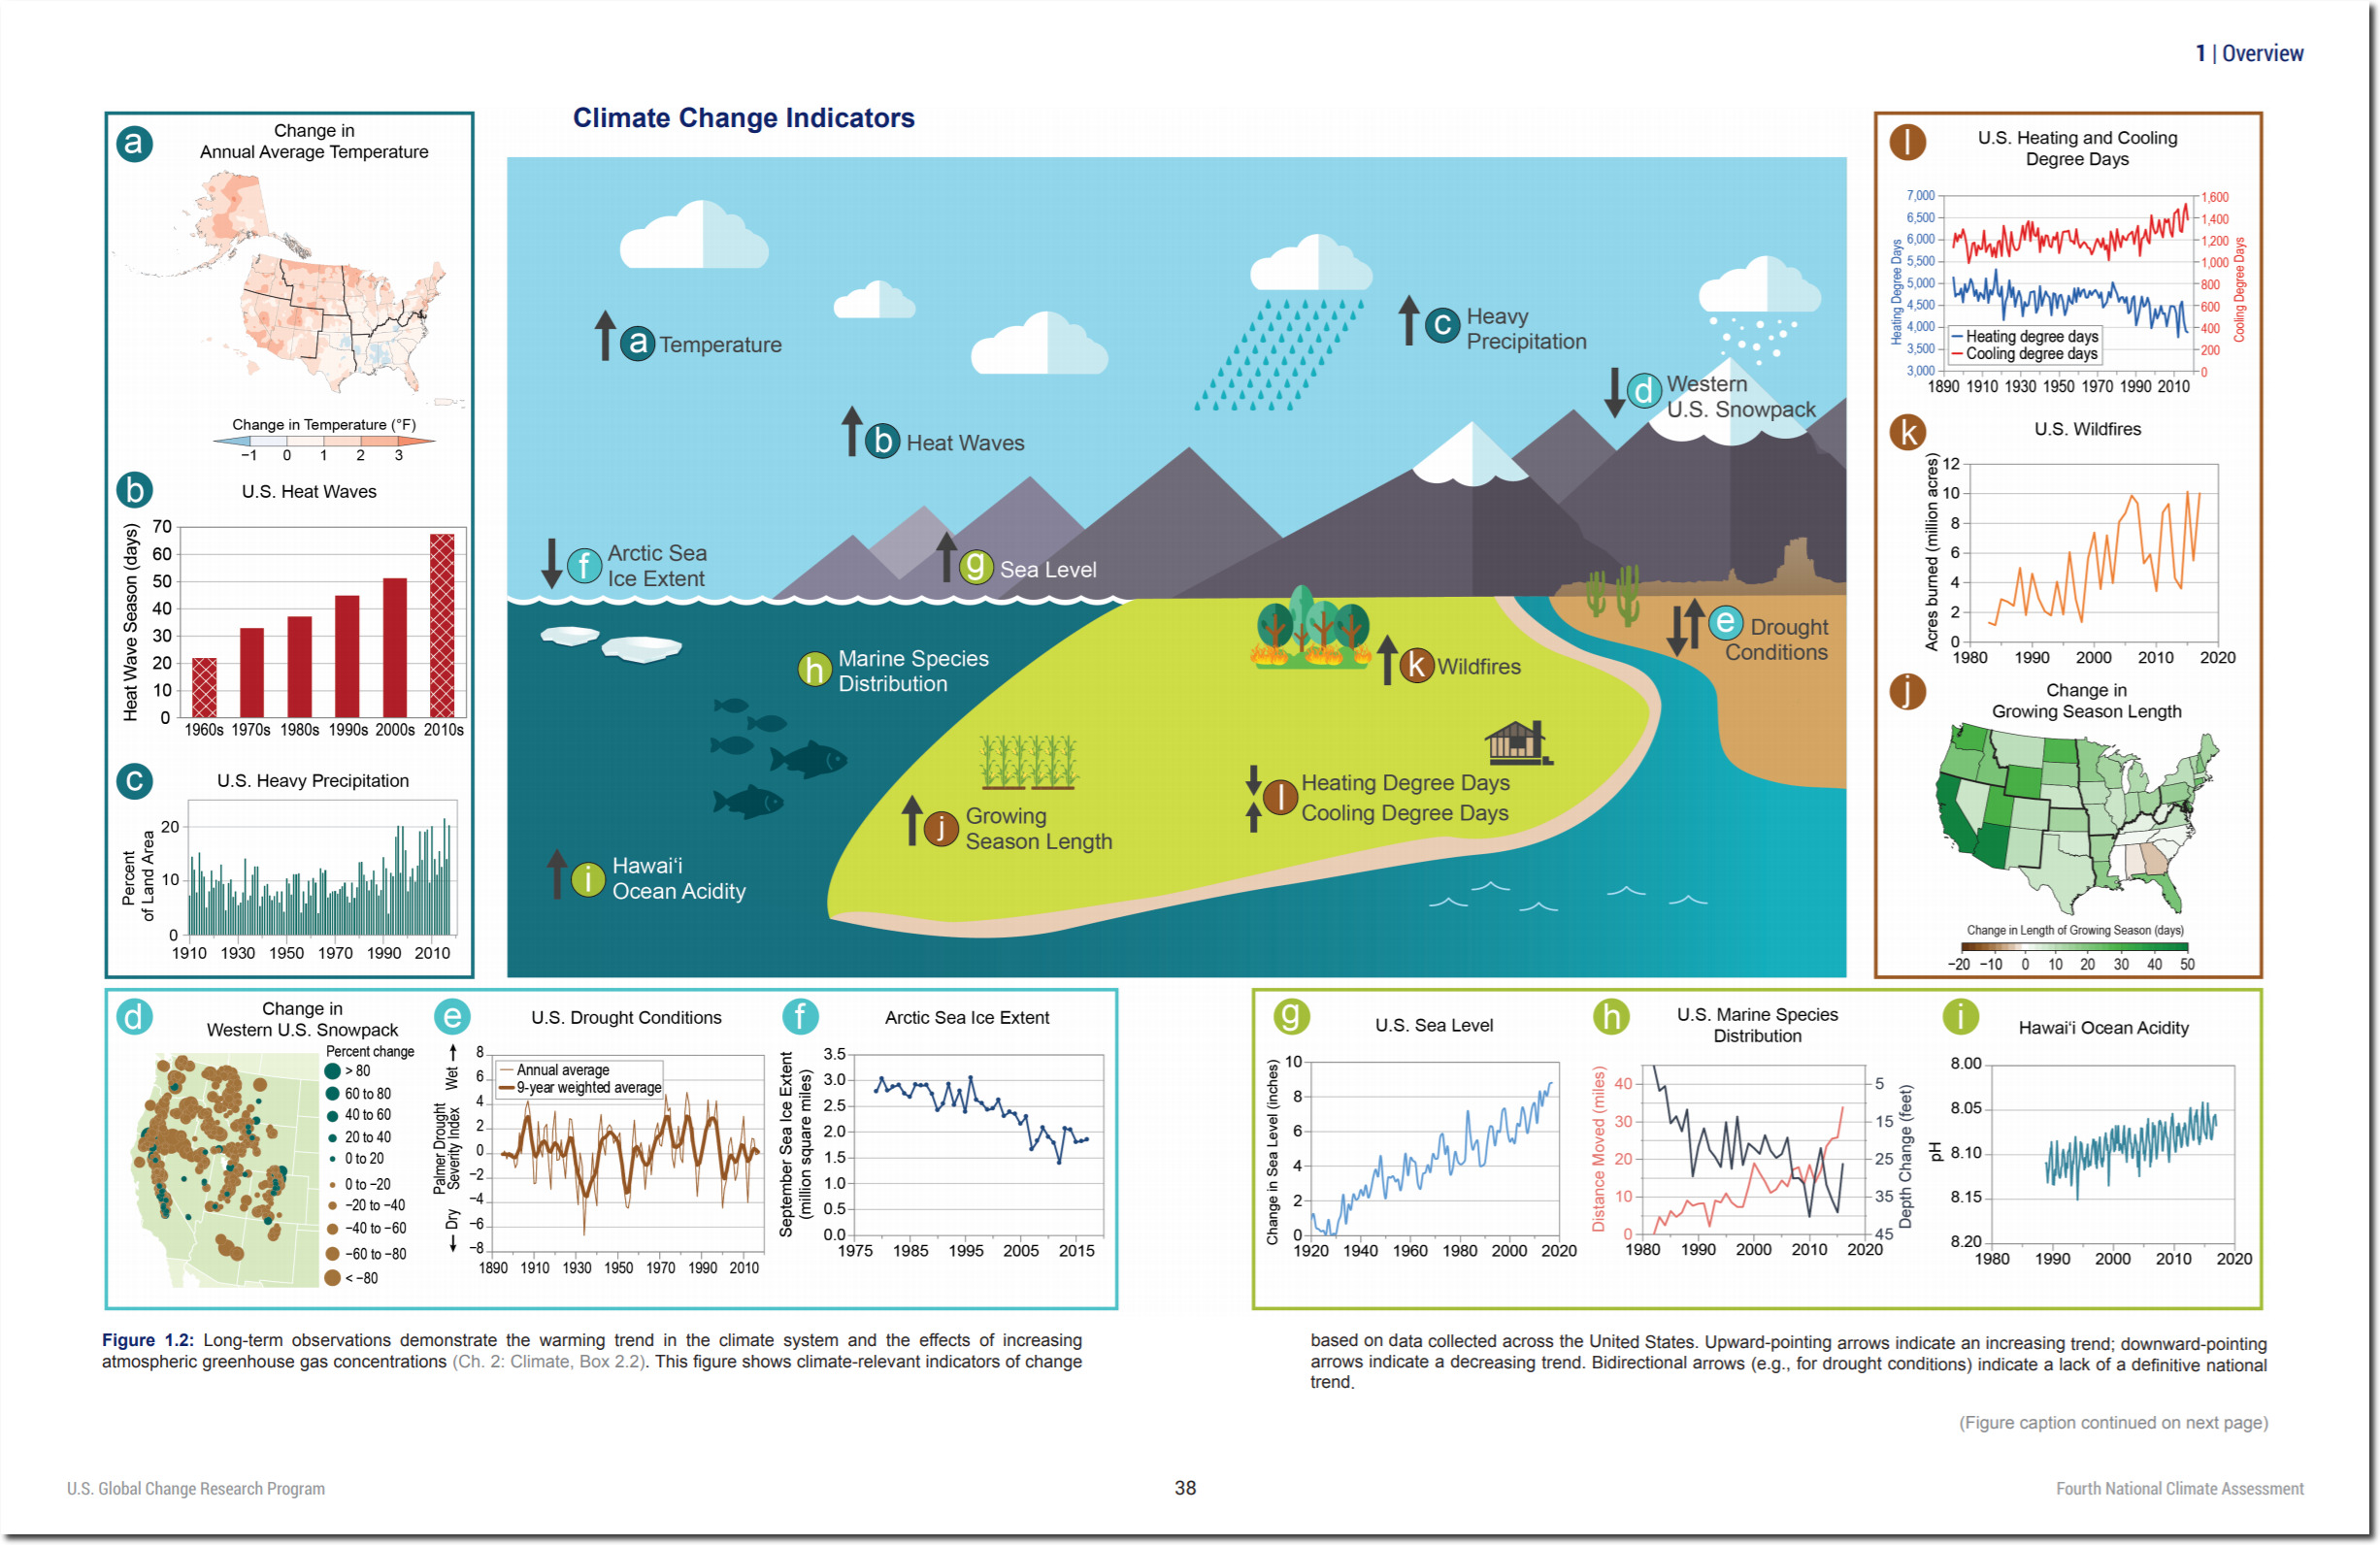
The graph was taken from page 38 of the Fourth National Climate Assessment document released in November 2018.
But why did they start their graph in 1983? The US has very detailed burn acreage data going back for more than a century, and it was much higher prior to 1970.
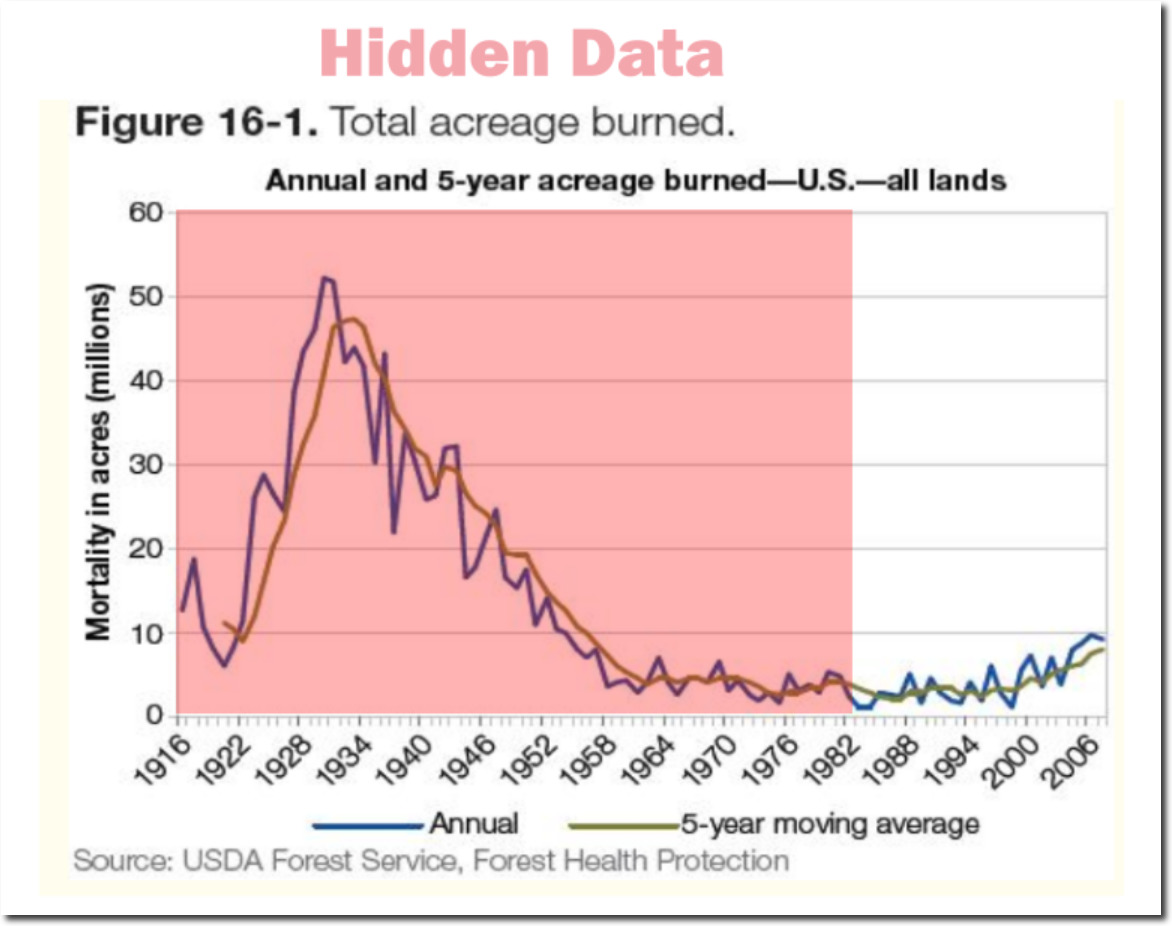
I overlaid the National Climate Assessment Graph on the Forest Service graph, and it becomes clear exactly what they are doing. Like in the the heatwave graph, they picked the lowest point for their start date, so that they could show an upwards trend – and deceive the public.
They hid essentially all of the essential data, which shows that burn acreage is down 80% in the US over the past 90 years.
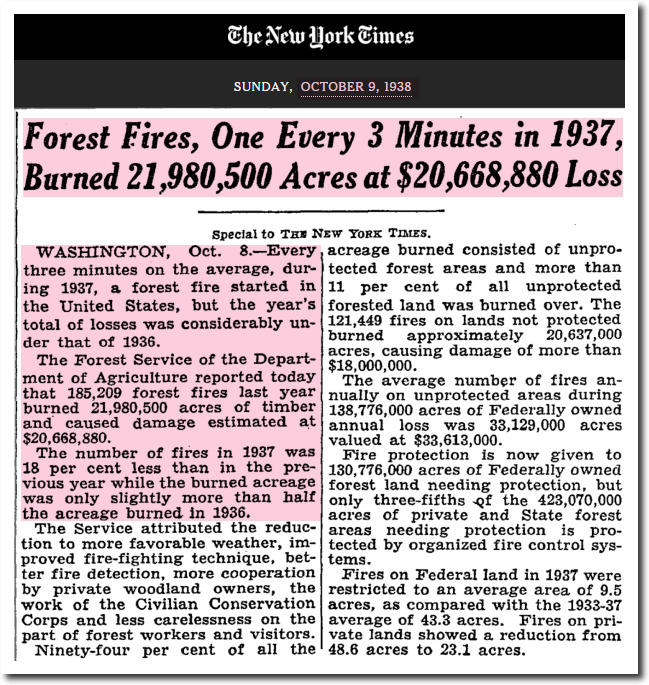
Burn acreage was very carefully tracked and reported during the 1930s. People split the atom and built the Golden Gate Bridge during the 1930s. It is not surprising that they also knew how to do the basic mathematics which climate scientists seem to be incapable of.
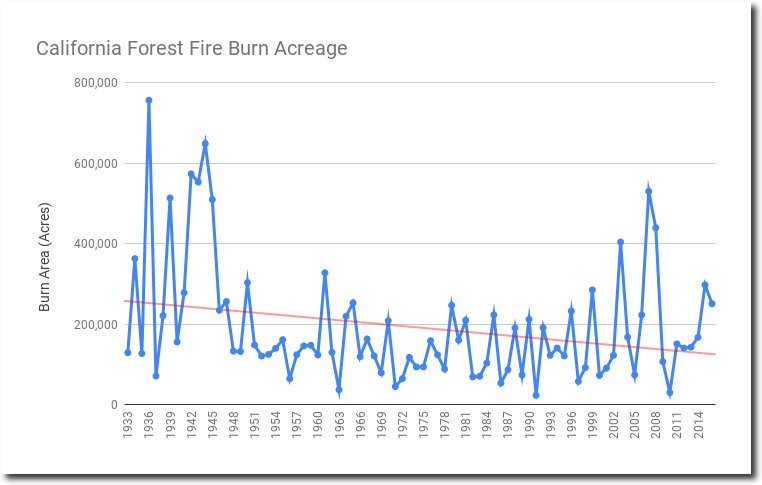
The same story in California. Last year had very high burn acreage, but the trend since the 1930’s is generally down.
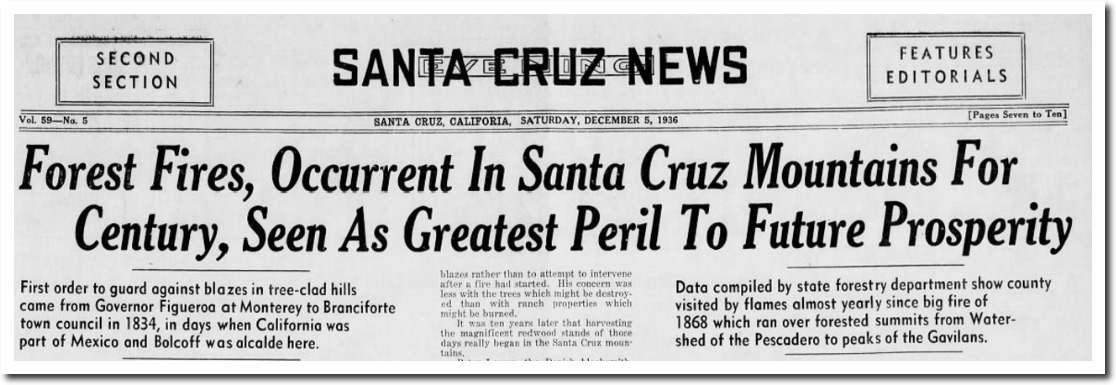
In 1936, forest fires were seen as the greatest threat to prosperity.
And as always, the fraudulent work of the National Climate Assessment is backed by many other fraudsters, like the Union of Concerned Scientists.