This is one of the best summaries of the climate change issue I've seen yet.
From
https://wattsupwiththat.com/2017/04/17/the-good-the-bad-and-the-null-hypothesis/
Guest post by David Middleton
Introduction
When debating the merits of the CAGW (catastrophic anthropogenic global warming) hypothesis, I often encounter this sort of straw man fallacy:
All that stuff is a distraction. Disprove the science of the greenhouse effect. Win a nobel prize get a million bucks. Forget the models and look at the facts. Global temperatures are year after year reaching record temperatures. Or do you want to deny that.
This is akin to arguing that one would have to disprove convection in order to falsify plate tectonics or genetics in order to falsify evolution. Plate tectonics and evolution are extremely robust scientific theories which rely on a combination of empirical and correlative evidence. Neither theory can be directly tested through controlled experimentation. However, both theories have been tested through decades of observations. Subsequent observations have largely conformed to these theories.
Note: I will not engage in debates about the validity of the scientific theories of plate tectonics or evolution.
The power of such scientific theories is demonstrated through their predictive skill: Theories are predictive of subsequent observations. This is why a robust scientific theory is even more powerful than facts (AKA observations).
CAGW is a similar type of theory hypothesis. It relies on empirical (the “good”) and correlative evidence (the “bad”).
The Good
Carbon dioxide is a so-called “greenhouse” gas. It retards radiative cooling. All other factors held equal, increasing the atmospheric concentration of CO2 will lead to a somewhat higher atmospheric temperature. However, all other things are never held equal in Earth and Atmospheric Science… The atmosphere is not air in a jar; references to Arrhenius have no signficance.
Atmospheric CO2 has risen since the 19th century.

Figure 2. Atmospheric CO2 from instrumental records, Antarctic ice cores and plant stomata.
Humans are responsible for at least half of this rise in atmospheric CO2.
Bill Chameides, dean of Duke University’s Nicholas School of the Environment and Earth Sciences, said Spencer’s arguments are what magicians call “ignoratio elenchi” or logical fallacy.”We’ve looked at every possible form of heat, including clouds, and the only source of heat is greenhouse gases,” he said, adding it’s insulting that Spencer would suggest scientists are paid to come to this conclusion. “Scientists make their reputation on debunking theories.”
Spencer said he wrote his book, a New York Times bestseller, because of the economic effects global warming policies have had on the poor. Alternative energy sources, like biofuels, have driven up the cost of food, which hurts people in Third World countries, he said.”Radical environmentalists are responsible for the deaths of millions of people — mostly black Africans,” he said, because they won’t allow those countries to use DDT pesticide to kill mosquitoes, which cause malaria. “And now they’re starving people because of biofuels.”
" data-medium-file="" data-large-file="" class="alignnone size-full wp-image-3125" src="https://debunkhouse.files.wordpress.com/2017/04/law1600.png?w=720" alt="law1600" style="height: auto; max-width: 98%; clear: both; display: block; margin: 8.39063px auto 0px; border: 1px solid rgb(204, 204, 204); padding: 5px;">
Figure 3. Natural sources probably account for ~50% of the rise in atmospheric CO2 since 1750.
While anthropogenic sources are a tiny fraction of the total sources, we are removing carbon from geologic sequestration and returning it to the active carbon cycle.
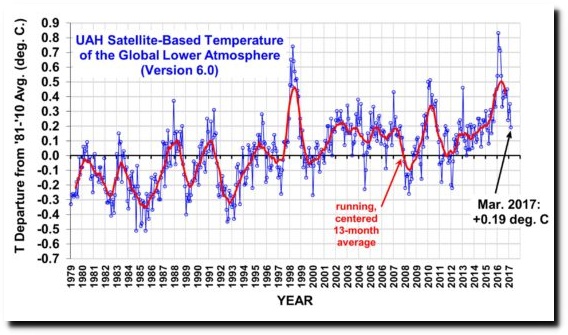
The average temperature of Earth’s surface and troposphere has generally risen over the past 150 years.

Figure 5. Surface temperature anomalies: BEST (land only), HadCRUT4 & GISTEMP. Satellite lower troposphere: UAH & RSS.
Atmospheric CO2 has risen and warming has occurred.
The Bad
The modern warming began long before the recent rise in atmospheric CO2 and prior to the 19th century temperature and CO2 were decoupled:

Figure 6. Temperature reconstruction (Moberg et al., 2005) and Law Dome CO2 (MacFarling Meure et al., 2006)
The recent rise in temperature is no more anomalous than the Medieval Warm Period or the Little Ice Age:

Figure 7. Temperature reconstruction (Ljungqvist, 2010), northern hemisphere instrumental temperature (HadCRUT4) and Law Dome CO2 (MacFarling Meure et al., 2006). Temperatures are 30-yr averages to reflect changing climatology.
Over the past 2,000 years, the average temperature of the Northern Hemisphere has exceeded natural variability (defined as two standard deviations from the pre-1865 mean) three times: 1) the peak of the Medieval Warm Period 2) the nadir of the Little Ice Age and 3) since 1998. Human activities clearly were not the cause of the first two deviations. 70% of the warming since the early 1600’s clearly falls within the range of natural variability.
While it is possible that the current warm period is about 0.2 °C warmer than the peak of the Medieval Warm Period, this could be due to the differing resolutions of the proxy reconstruction and instrumental data:

Figure 8. The instrumental data demonstrate (higher frequency and higher amplitude temperature variations than the proxy reconstructions.
The amplitude of the reconstructed temperature variability on centennial time-scales exceeds 0.6°C. This reconstruction is the first to show a distinct Roman Warm Period c. AD 1-300, reaching up to the 1961-1990 mean temperature level, followed by the Dark Age Cold Period c. AD 300-800. The Medieval Warm Period is seen c. AD 800–1300 and the Little Ice Age is clearly visible c. AD 1300-1900, followed by a rapid temperature increase in the twentieth century. The highest average temperatures in the reconstruction are encountered in the mid to late tenth century and the lowest in the late seventeenth century. Decadal mean temperatures seem to have reached or exceeded the 1961-1990 mean temperature level during substantial parts of the Roman Warm Period and the Medieval Warm Period. The temperature of the last two decades, however, is possibly higher than during any previous time in the past two millennia, although this is only seen in the instrumental temperature data and not in the multi-proxy reconstruction itself.
[…]
The proxy reconstruction itself does not show such an unprecedented warming but we must consider that only a few records used in the reconstruction extend into the 1990s. Nevertheless, a very cautious interpretation of the level of warmth since AD 1990 compared to that of the peak warming during the Roman Warm Period and the Medieval Warm Period is strongly suggested.
[…]
The amplitude of the temperature variability on multi-decadal to centennial time-scales reconstructed here should presumably be considered to be the minimum of the true variability on those time-scales.
[…]

Figure 9. Ljungqvist demonstrates that the modern warming has not unambiguously exceeded the range of natural variability. The bold black dashed line is the instrumental record. I added The red lines to highlight the margin of error.
The climate of the Holocene has been characterized by a roughly millennial cycle of warming and cooling (for those who don’t like the word “cycle,” pretend that I typed “quasi-periodic fluctuation”):

Figure 10. Millennial cycle apparent on Ljungqvist reconstruction.

Figure 11. Millennial scale cycle apparent on Moberg reconstruction.
These cycles (quasi-periodic fluctuations) even have names:

Figure 12. Late Holocene climate cycles (quasi-periodic fluctuations).
These cycles have been long recognized by Quaternary geologists:
Fourier analysis of the GISP2 ice core clearly demonstrates that the millennial scale climate cycle is the dominant signal in the Holocene (Davis & Bohling, 2001).

Figure 13. The Holocene climate has been dominated by a millennial scale climate cycle.
The industrial era climate has not changed in any manner inconsistent with the well-established natural millennial scale cycle. Assuming that the ice core CO2 is reliable, the modern rise in CO2 has had little, if any effect on climate.
The Null Hypothesis
What is a ‘Null Hypothesis’
A null hypothesis is a type of hypothesis used in statistics that proposes that no statistical significance exists in a set of given observations. The null hypothesis attempts to show that no variation exists between variables or that a single variable is no different than its mean. It is presumed to be true until statistical evidence nullifies it for an alternative hypothesis.
Since it is impossible to run a controlled experiment on Earth’s climate (there is no control planet), the only way to “test” the CAGW hypothesis is through models. If the CAGW hypothesis is valid, the models should demonstrate predictive skill. The models have utterly failed:
From Hansen et al. 1988 through every IPCC assessment report, the observed temperatures have consistently tracked the strong mitigation scenarios in which the rise in atmospheric CO2 has been slowed and/or halted.
Apart from the strong El Niño events of 1998 and 2015-16, GISTEMP has tracked Scenario C, in which CO2 levels stopped rising in 2000, holding at 368 ppm.

Figure 16. Hansen’s 1988 model and GISTEMP.
The utter failure of this model is most apparent on the more climate-relevant 5-yr running mean:

Figure 17. Hansen’s 1988 model and GISTEMP, 5-yr running mean.
This is from IPCC’s First Assessment Report:

Figure 18. IPCC First Assessment Report (FAR). Model vs. HadCRUT4.
HadCRUT4 has tracked below Scenario D.

Figure 19. IPCC FAR scenarios.
This is from the IPCC’s Third Assessment Report (TAR):

Figure 20. IPCC TAR model vs. HadCRUT4.
HadCRUT4 has tracked the strong mitigation scenarios, despite a general lack of mitigation.
The climate models have never demonstrated any predictive skill.
And the models aren’t getting better. Even when they start the model run in 2006, the observed temperatures consistently track at or below the low end 5-95% range. Observed temperatures only approach the model mean (P50) in 2006, 2015 and 2016.

Figure 22. Figure 21 with individual model runs displayed.
When we drill wells, we run probability distributions to estimate the oil and gas reserves we will add if the well is successful. The model inputs consist of a range of estimates of reservoir thickness, area and petrophysical characteristics. The model output consists of a probability distribution from P10 to P90.
- P10 = Maximum Case. There is a 10% probability that the well will produce at least this much oil and/or gas.
- P50 = Mean Case. There is a 50% probability that the well will produce at least this much oil and/or gas. Probable reserves are >P50.
- P90 = Minimum Case. There is a 90% probability that the well will produce at least this much oil and/or gas. Proved reserves are P90.
Over time, a drilling program should track near P50. If your drilling results track close to P10 or P90, your model input is seriously flawed.
If the CMIP5 model ensemble had predictive skill, the observations should track around P50, half the runs should predict more warming and half less than is actually observed. During the predictive run of the model, HadCRUT4.5 has not *tracked* anywhere near P50…

Figure 23. Figure 21 zoomed in on model run period with probability distributions annotated.
I “eyeballed” the instrumental observations to estimate a probability distribution of predictive run of the model.
Prediction Run Approximate Distribution
2006 P60 (60% of the models predicted a warmer temperature)
2007 P75
2008 P95
2009 P80
2010 P70
2011-2013 >P95
2014 P90
2015-2016 P55
Note that during the 1998-99 El Niño, the observations spiked above P05 (less than 5% of the models predicted this). During the 2015-16 El Niño, HadCRUT only spiked to P55. El Niño events are not P50 conditions. Strong El Niño and La Niña events should spike toward the P05 and P95 boundaries.
The temperature observations are clearly tracking much closer to strong mitigation scenarios rather than RCP 8.5, the bogus “business as usual” scenario.
The red hachured trapezoid indicates that HadCRUT4.5 will continue to track between less than P100 and P50. This is indicative of a miserable failure of the models and a pretty good clue that the models need be adjusted downward.
In any other field of science CAGW would be a long-discarded falsified hypothesis.
Conclusion
Claims that AGW or CAGW have earned an exemption from the Null Hypothesis principle are patently ridiculous.
In science, a broad, natural explanation for a wide range of phenomena. Theories are concise, coherent, systematic, predictive, and broadly applicable, often integrating and generalizing many hypotheses. Theories accepted by the scientific community are generally strongly supported by many different lines of evidence-but even theories may be modified or overturned if warranted by new evidence and perspectives.
This is not a scientific hypothesis:
More CO2 will cause some warming.
It is arm waving.
This is a scientific hypothesis:
A doubling of atmospheric CO2 will cause the lower troposphere to warm by ___ °C.
Thirty-plus years of failed climate models never been able to fill in the blank. The IPCC’s Fifth Assessment Report
essentially stated that it was no longer necessary to fill in the blank.
While it is very likely that human activities are the cause of at least some of the warming over the past 150 years, there is no robust statistical correlation. The failure of the climate models clearly demonstrates that the null hypothesis still holds true for atmospheric CO2 and temperature.
Selected References
Davis, J. C., and G. C. Bohling, The search for patterns in ice-core temperature curves, 2001, in L. C. Gerhard, W. E. Harrison, and B. M. Hanson, eds., Geological perspectives of global climate change, p. 213–229.
Finsinger, W. and F. Wagner-Cremer. Stomatal-based inference models for reconstruction of atmospheric CO2 concentration: a method assessment using a calibration and validation approach. The Holocene 19,5 (2009) pp. 757–764
Grosjean, M., Suter, P. J., Trachsel, M. and Wanner, H. 2007. Ice-borne prehistoric finds in the Swiss Alps reflect Holocene glacier fluctuations. J. Quaternary Sci.,Vol. 22 pp. 203–207. ISSN 0267-8179.
Hansen, J., I. Fung, A. Lacis, D. Rind, Lebedeff, R. Ruedy, G. Russell, and P. Stone, 1988: Global climate changes as forecast by Goddard Institute for Space Studies three-dimensional model. J. Geophys. Res., 93, 9341-9364, doi:10.1029/88JD00231.
Kouwenberg, LLR, Wagner F, Kurschner WM, Visscher H (2005) Atmospheric CO2 fluctuations during the last millennium reconstructed by stomatal frequency analysis of Tsuga heterophylla needles. Geology 33:33–36
Ljungqvist, F.C. 2009. N. Hemisphere Extra-Tropics 2,000yr Decadal Temperature Reconstruction. IGBP PAGES/World Data Center for Paleoclimatology Data Contribution Series # 2010-089. NOAA/NCDC Paleoclimatology Program, Boulder CO, USA.
Ljungqvist, F.C. 2010. A new reconstruction of temperature variability in the extra-tropical Northern Hemisphere during the last two millennia. Geografiska Annaler: Physical Geography, Vol. 92 A(3), pp. 339-351, September 2010. DOI: 10.1111/j.1468-459.2010.00399.x
MacFarling Meure, C., D. Etheridge, C. Trudinger, P. Steele, R. Langenfelds, T. van Ommen, A. Smith, and J. Elkins. 2006. The Law Dome CO2, CH4 and N2O Ice Core Records Extended to 2000 years BP. Geophysical Research Letters, Vol. 33, No. 14, L14810 10.1029/2006GL026152.
Moberg, A., D.M. Sonechkin, K. Holmgren, N.M. Datsenko and W. Karlén. 2005. Highly variable Northern Hemisphere temperatures reconstructed from low-and high-resolution proxy data. Nature, Vol. 433, No. 7026, pp. 613-617, 10 February 2005.
Instrumental Temperature Data from Hadley Centre / UEA CRU, NASA Goddard Institute for Space Studies and Berkeley Earth Surface Temperature Project via Wood for Trees.


SPURWING PLOVER
CHARLES S. OPALEK, PE
* ice continues to accumulate at record levels in the Antarctic wherein lies 90% of the world’s ice inventory. Meanwhile, the Arctic Ice Cap has survived decades of predictions of its demise.
* sea level rise according to Nils-Axil Morner, the world’s leading authority on sea level change, has not changed at all.
* annual accumulated cyclonic energy is at historical lows, as are the overall number and strength of hurricanes and tornadoes.
* Droughts and floods continue their march in tune with oceanic oscillations, such as, La Ninas and the Indian Ocean Dipole.
* Forest fire activity remains at the mercy of lightning strikes, underbrush stockpiles and interference with nature by humans.
* Anecdotes are short, obscure historical or biographical accounts. Anecdotes cannot be traced to one another or anything else. Anecdotes are not proof.
* Computer projections are Ludic fallacies based on dubious initial conditions. The computer projections have failed, because their only input is greenhouse gases. Computer projections are not proof.
* Hockey Sticks are the cobbling together of two unrelated proxy data sets. These FrankenGraphs, which would have received an “F” in JHS science class 50 years ago, are incredibly embraced by many scientists today. Hockey Sticks are artificial fabrications, not proof.
* Consensus is an opinion or position reached by a group as a whole. Millennia and centuries ago the consensus believed the Earth was the center of the Universe and Solar System. Consensus is not proof.
* Banks and brokerage houses reap huge commissions from it.
* Scam artists like Maurice Strong thrive on it, creating schemes like carbon trading which suck billions of dollars from consumers’ wallets.
* Politicians need it to save us from imaginary hobgoblins and to justify tax increases to fund largesse programs that garner votes.
* Scientists keep busy by grazing at the trough of free grant money made available, but only if it can be shown that man is the cause.
* Corporations need it to sell cures for which there is no disease, and fatten up their bottom lines.
* The alternative energy, Green Building and sustainability industries came into existence and thrive off of it.
* The news media needs it to keep the frenzy going, the ratings up, and ad revenue coming in.
* The United Nations needs it to forge its role as the leader in One World Governance.
* Environmentalists, anti-industrialists, and other Communists need it in order to cut the legs out from underneath the evil, Capitalist United States and level the playing field for the world‘s less fortunate nations.
http://www.windpowerfraud.com
http://www.aconvenientfabrication.com