Let nobody tell you that the second decade of the 21st century has been a bad time. We are living through the greatest improvement in human living standards in history. Extreme poverty has fallen below 10 per cent of the world’s population for the first time. It was 60 per cent when I was born. Global inequality has been plunging as Africa and Asia experience faster economic growth than Europe and North America; child mortality has fallen to record low levels; famine virtually went extinct; malaria, polio and heart disease are all in decline.
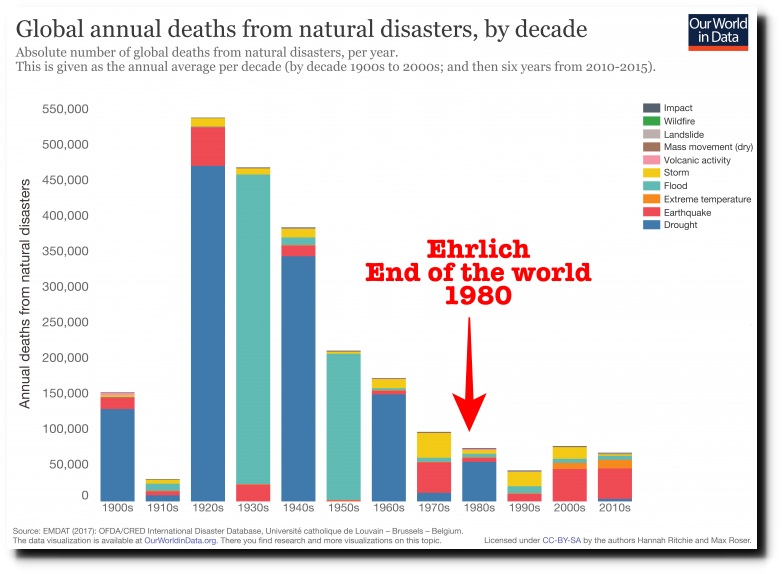
Little of this made the news, because good news is no news. But I’ve been watching it all closely. Ever since I wrote The Rational Optimist in 2010, I’ve been faced with ‘what about…’ questions: what about the great recession, the euro crisis, Syria, Ukraine, Donald Trump? How can I possibly say that things are getting better, given all that? The answer is: because bad things happen while the world still gets better. Yet get better it does, and it has done so over the course of this decade at a rate that has astonished even starry-eyed me.
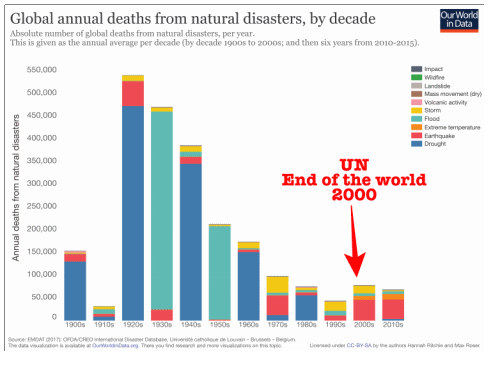
Perhaps one of the least fashionable predictions I made nine years ago was that ‘the ecological footprint of human activity is probably shrinking’ and ‘we are getting more sustainable, not less, in the way we use the planet’. That is to say: our population and economy would grow, but we’d learn how to reduce what we take from the planet. And so it has proved. An MIT scientist, Andrew McAfee, recently documented this in a book called More from Less, showing how some nations are beginning to use less stuff: less metal, less water, less land. Not just in proportion to productivity: less stuff overall.
This does not quite fit with what the Extinction Rebellion lot are telling us. But the next time you hear Sir David Attenborough say: ‘Anyone who thinks that you can have infinite growth on a planet with finite resources is either a madman or an economist’, ask him this: ‘But what if economic growth means using less stuff, not more?’ For example, a normal drink can today contains 13 grams of aluminium, much of it recycled. In 1959, it contained 85 grams. Substituting the former for the latter is a contribution to economic growth, but it reduces the resources consumed per drink.
As for Britain, our consumption of ‘stuff’ probably peaked around the turn of the century — an achievement that has gone almost entirely unnoticed. But the evidence is there. In 2011 Chris Goodall, an investor in electric vehicles, published research showing that the UK was now using not just relatively less ‘stuff’ every year, but absolutely less. Events have since vindicated his thesis. The quantity of all resources consumed per person in Britain (domestic extraction of biomass, metals, minerals and fossil fuels, plus imports minus exports) fell by a third between 2000 and 2017, from 12.5 tonnes to 8.5 tonnes. That’s a faster decline than the increase in the number of people, so it means fewer resources consumed overall.
If this doesn’t seem to make sense, then think about your own home. Mobile phones have the computing power of room-sized computers of the 1970s. I use mine instead of a camera, radio, torch, compass, map, calendar, watch, CD player, newspaper and pack of cards. LED light bulbs consume about a quarter as much electricity as incandescent bulbs for the same light. Modern buildings generally contain less steel and more of it is recycled. Offices are not yet paperless, but they use much less paper.
Even in cases when the use of stuff is not falling, it is rising more slowly than expected. For instance, experts in the 1970s forecast how much water the world would consume in the year 2000. In fact, the total usage that year was half as much as predicted. Not because there were fewer humans, but because human inventiveness allowed more efficient irrigation for agriculture, the biggest user of water.
Until recently, most economists assumed that these improvements were almost always in vain, because of rebound effects: if you cut the cost of something, people would just use more of it. Make lights less energy-hungry and people leave them on for longer. This is known as the Jevons paradox, after the 19th-century economist William Stanley Jevons, who first described it. But Andrew McAfee argues that the Jevons paradox doesn’t hold up. Suppose you switch from incandescent to LED bulbs in your house and save about three-quarters of your electricity bill for lighting. You might leave more lights on for longer, but surely not four times as long.
Efficiencies in agriculture mean the world is now approaching ‘peak farmland’ — despite the growing number of people and their demand for more and better food, the productivity of agriculture is rising so fast that human needs can be supplied by a shrinking amount of land. In 2012, Jesse Ausubel of Rockefeller University and his colleagues argued that, thanks to modern technology, we use 65 per cent less land to produce a given quantity of food compared with 50 years ago. By 2050, it’s estimated that an area the size of India will have been released from the plough and the cow.
Land-sparing is the reason that forests are expanding, especially in rich countries. In 2006 Ausubel worked out that no reasonably wealthy country had a falling stock of forest, in terms of both tree density and acreage. Large animals are returning in abundance in rich countries; populations of wolves, deer, beavers, lynx, seals, sea eagles and bald eagles are all increasing; and now even tiger numbers are slowly climbing.
Perhaps the most surprising statistic is that Britain is using steadily less energy. John Constable of the Global Warming Policy Forum points out that although the UK’s economy has almost trebled in size since 1970, and our population is up by 20 per cent, total primary inland energy consumption has actually fallen by almost 10 per cent. Much of that decline has happened in recent years. This is not necessarily good news, Constable argues: although the improving energy efficiency of light bulbs, aeroplanes and cars is part of the story, it also means we are importing more embedded energy in products, having driven much of our steel, aluminium and chemical industries abroad with some of the highest energy prices for industry in the world.
In fact, all this energy-saving might cause problems. Innovation requires experiments (most of which fail). Experiments require energy. So cheap energy is crucial — as shown by the industrial revolution. Thus, energy may be the one resource that a prospering population should be using more of. Fortunately, it is now possible that nuclear fusion will one day deliver energy in minimalist form, using very little fuel and land.
Since its inception, the environmental movement has been obsessed by finite resources. The two books that kicked off the green industry in the early 1970s, The Limits to Growth in America and Blueprint for Survival in Britain, both lamented the imminent exhaustion of metals, minerals and fuels. The Limits to Growth predicted that if growth continued, the world would run out of gold, mercury, silver, tin, zinc, copper and lead well before 2000. School textbooks soon echoed these claims.
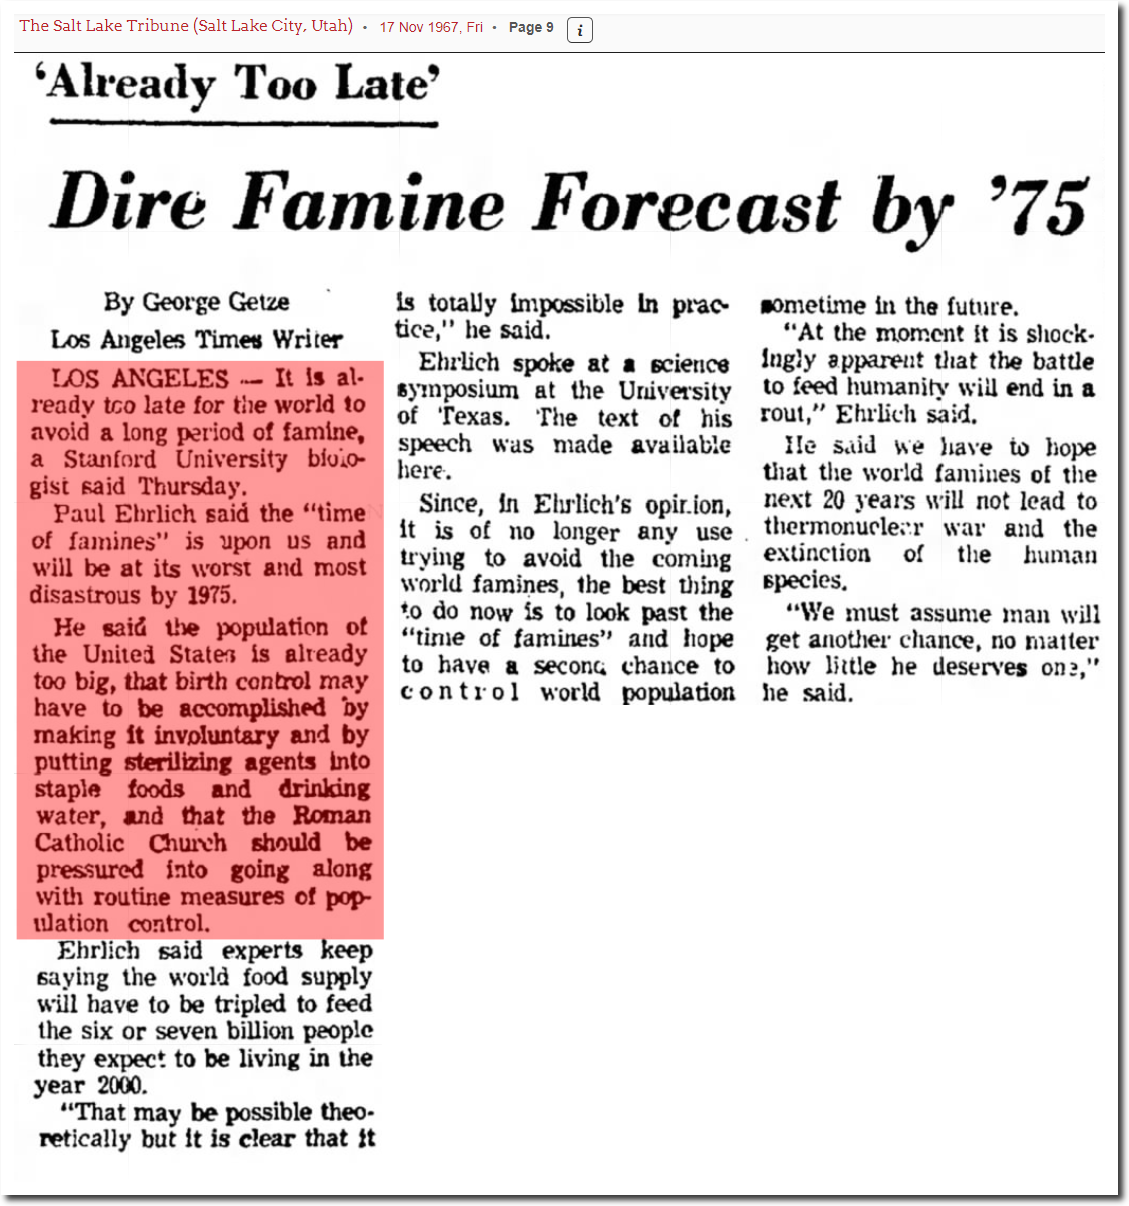
This caused the economist Julian Simon to challenge the ecologist Paul Ehrlich to a bet that a basket of five metals (chosen by Ehrlich) would cost less in 1990 than in 1980. The Stone Age did not end for lack of stone, Simon said, arguing that we would find substitutes if metals grew scarce. Simon won the bet easily, although Ehrlich wrote the cheque with reluctance, sniping that ‘the one thing we’ll never run out of is imbeciles’. To this day none of those metals has significantly risen in price or fallen in volume of reserves, let alone run out. (One of my treasured possessions is the Julian Simon award I won in 2012, made from the five metals.)
A modern irony is that many green policies advocated now would actually reverse the trend towards using less stuff.
Thanks go to Tony Heller, who first collected many of these news clips and posted them on RealClimateScience.
SUMMARY
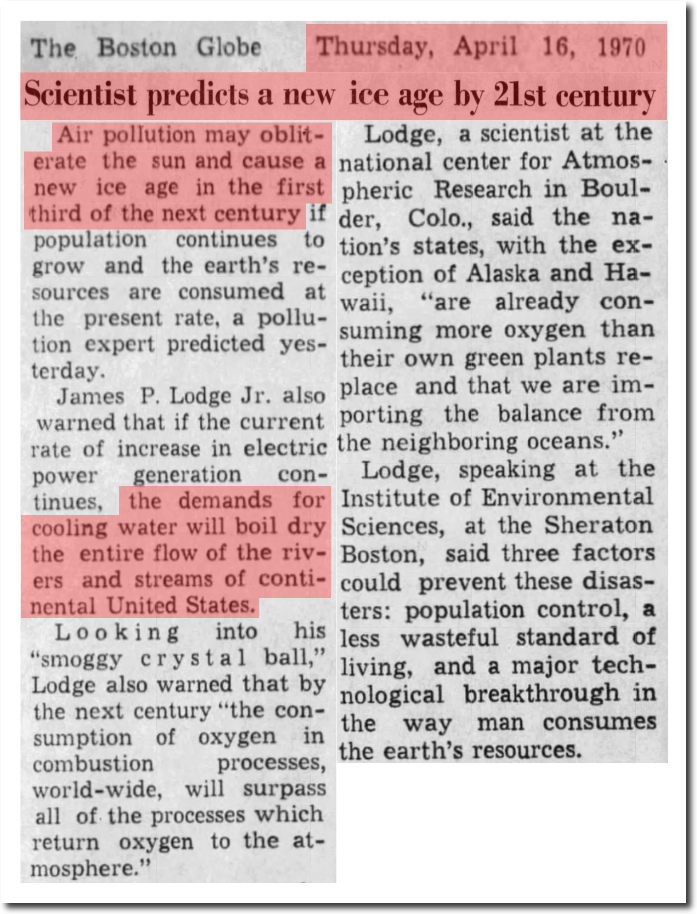
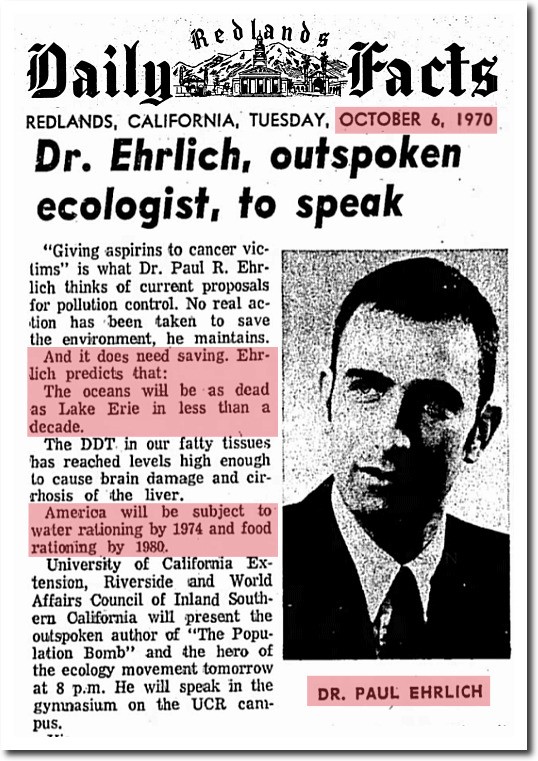
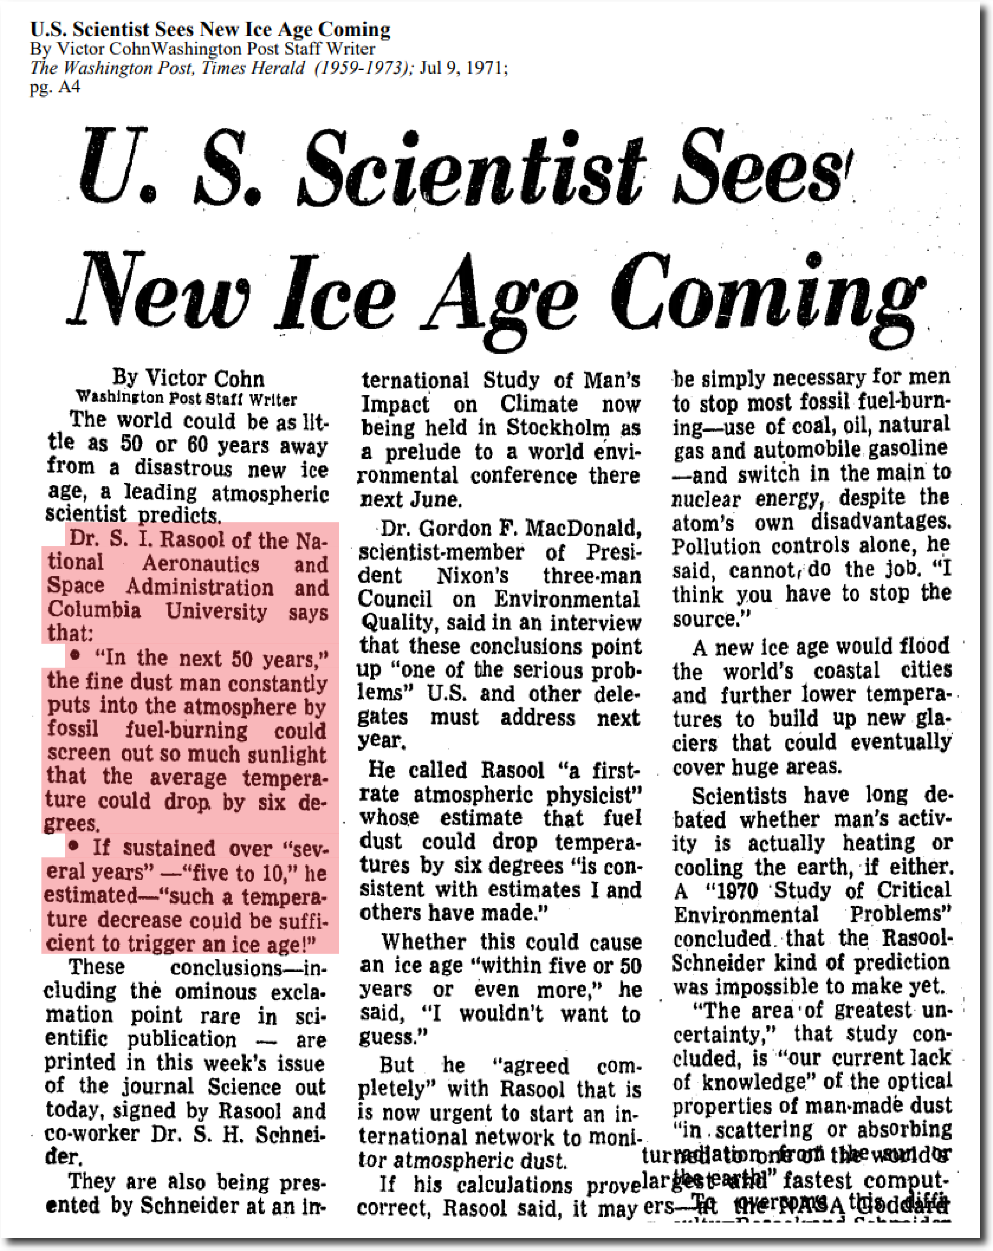
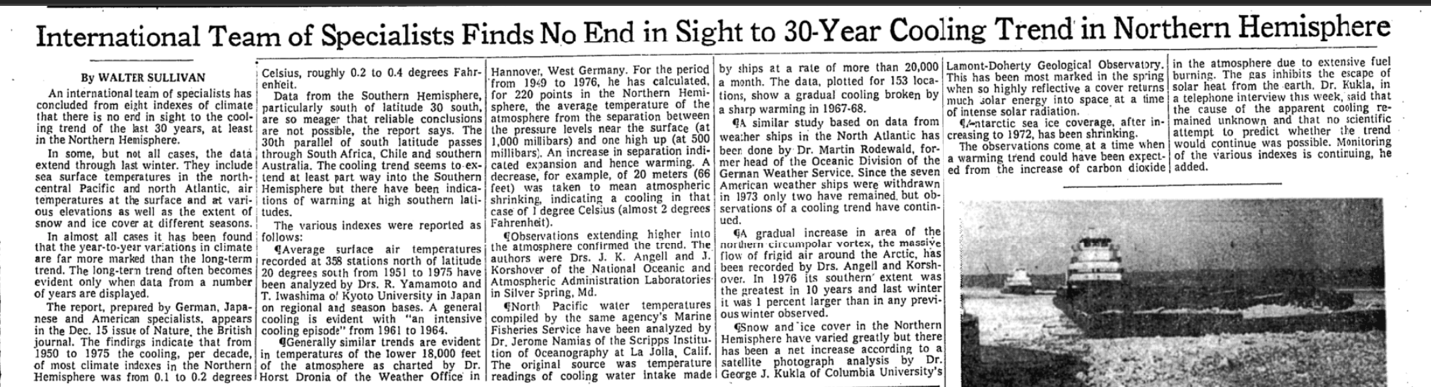
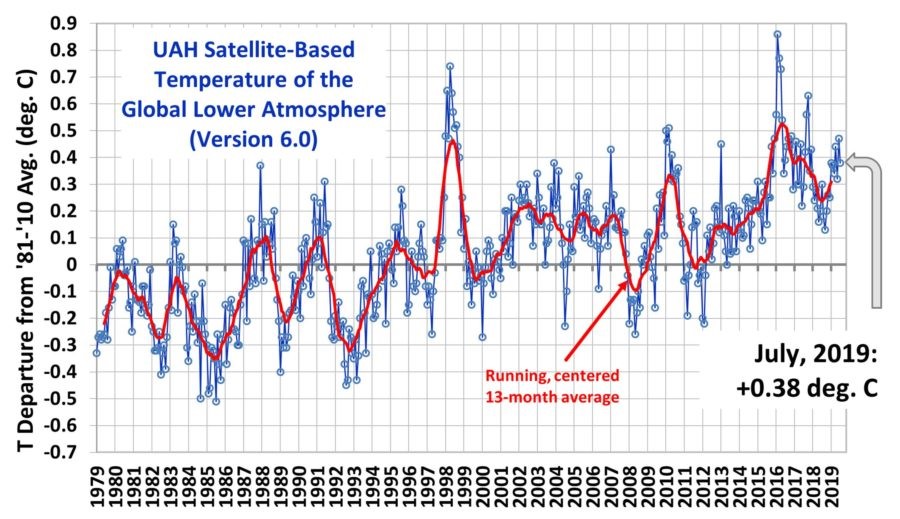
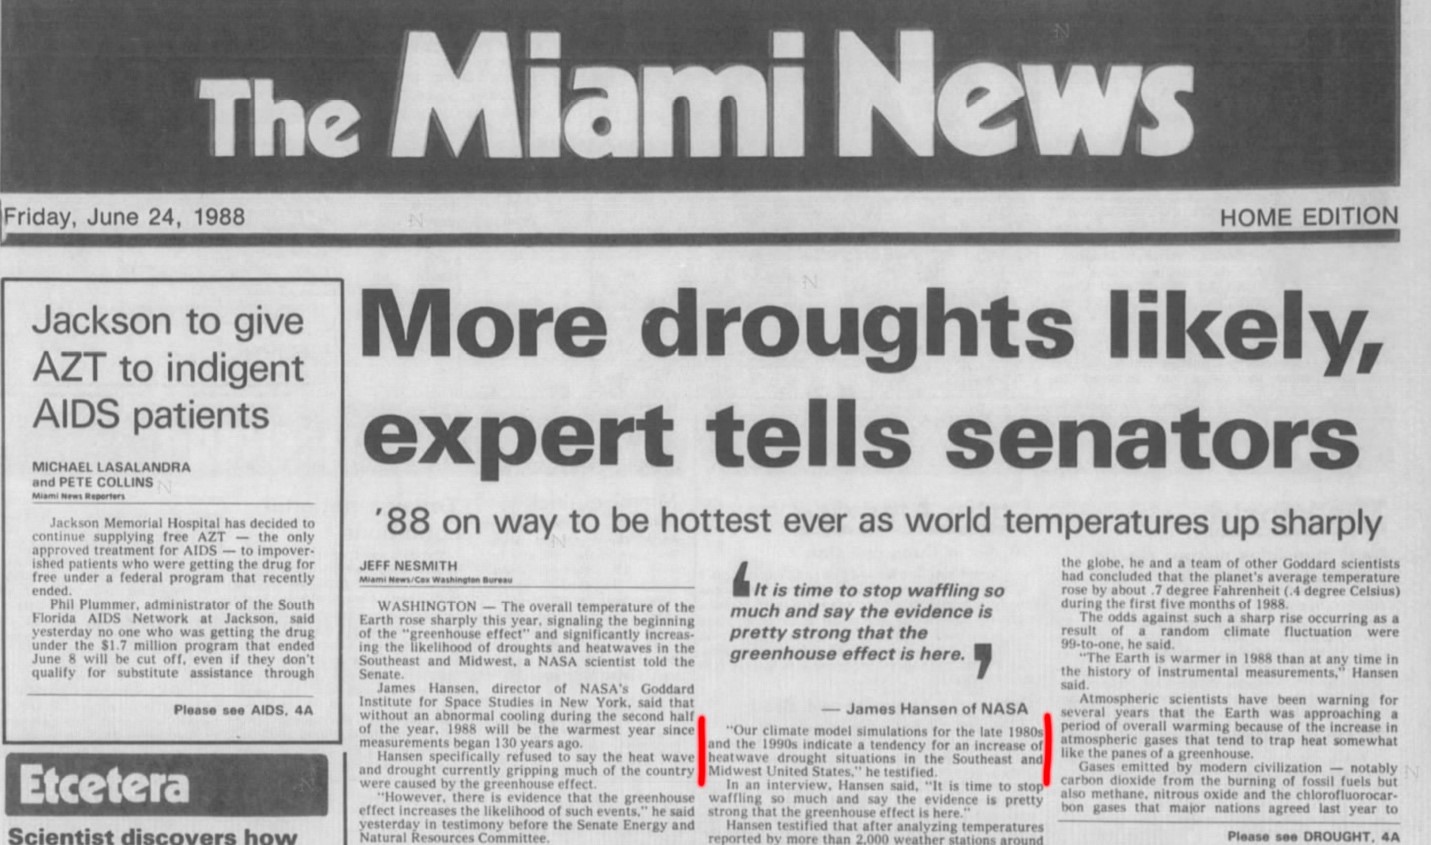
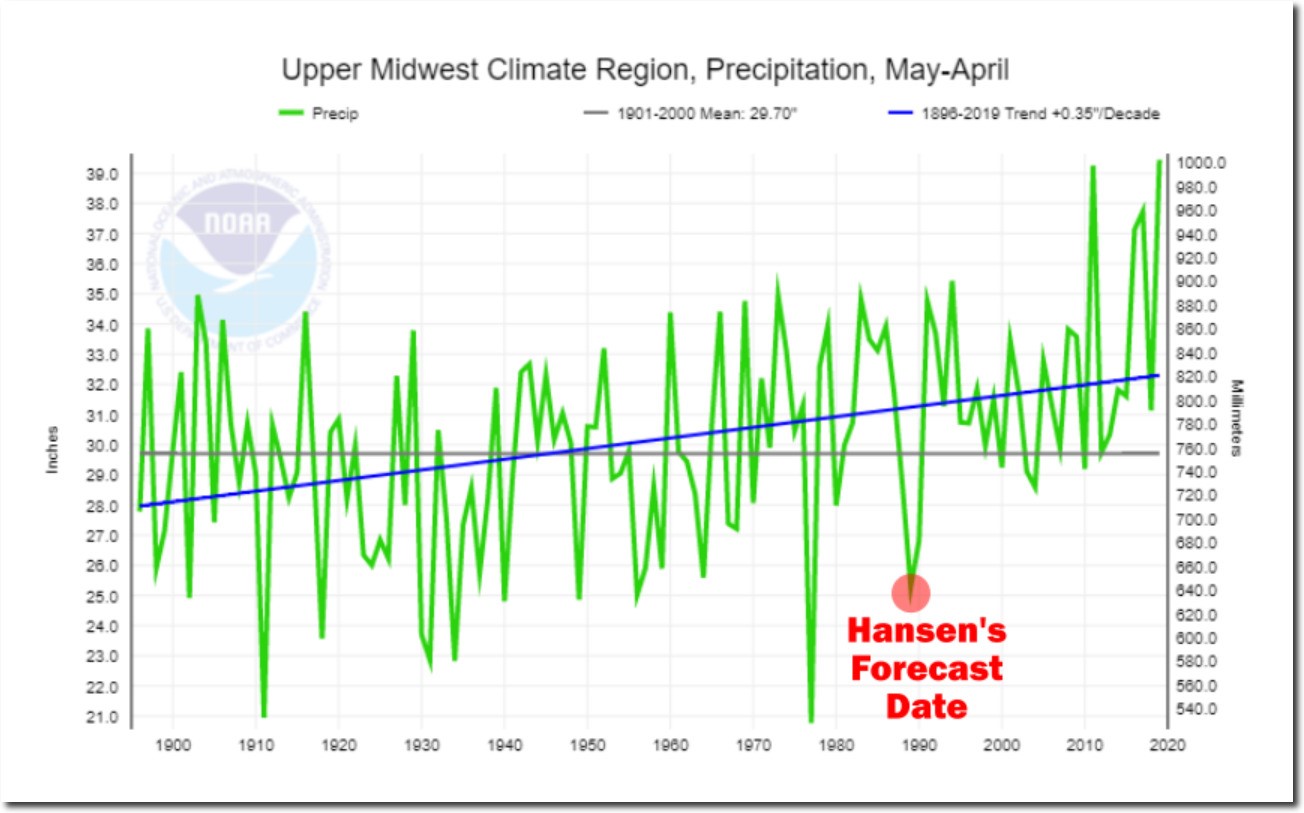
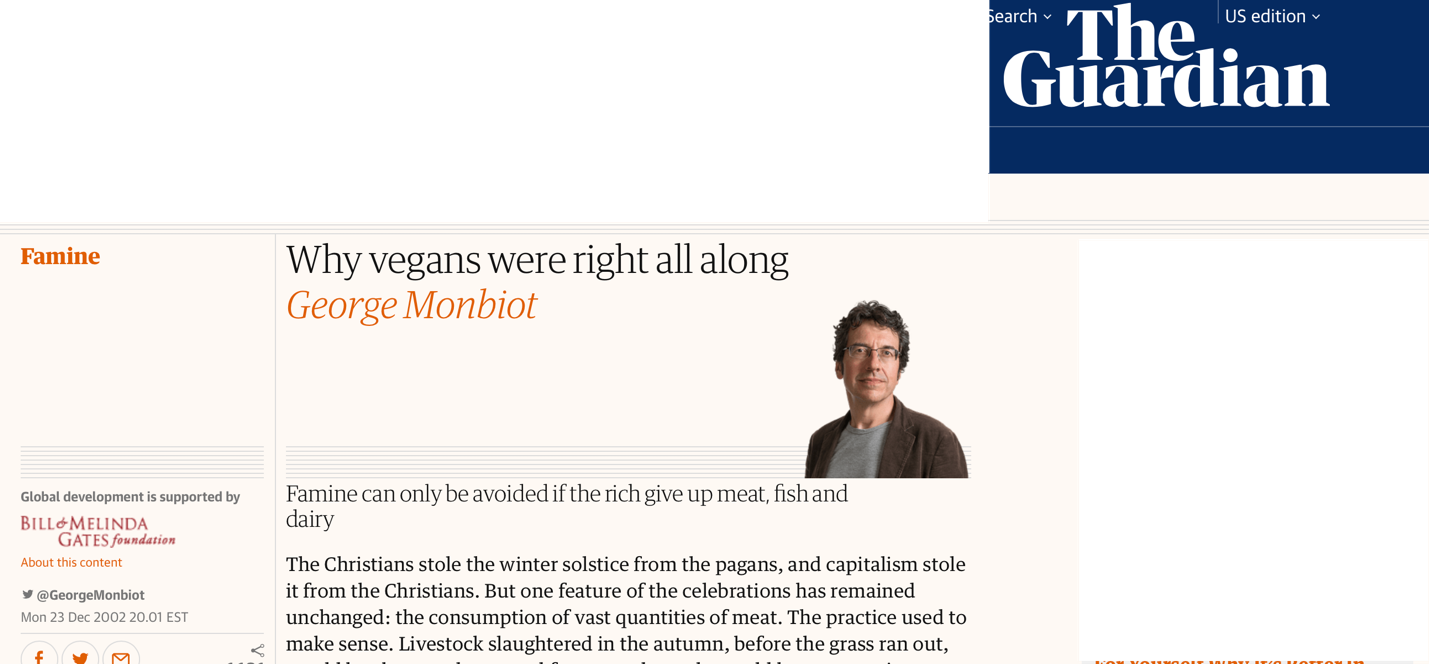
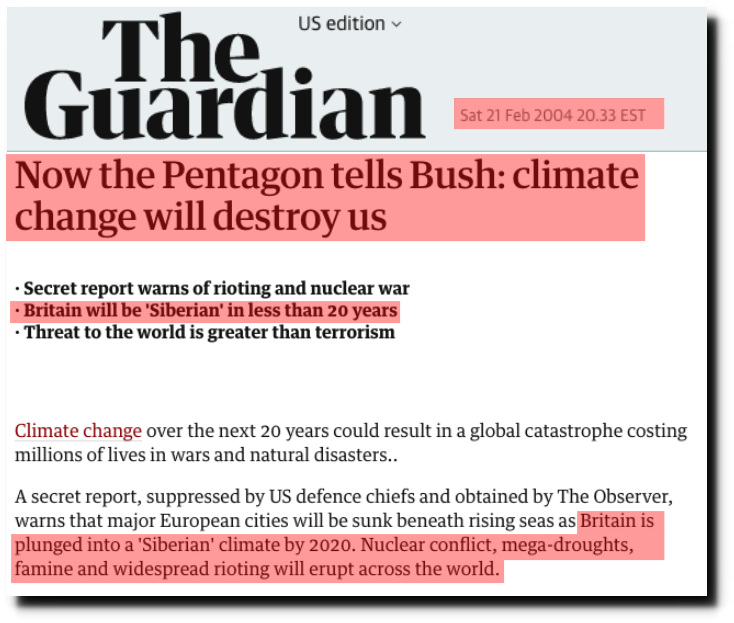
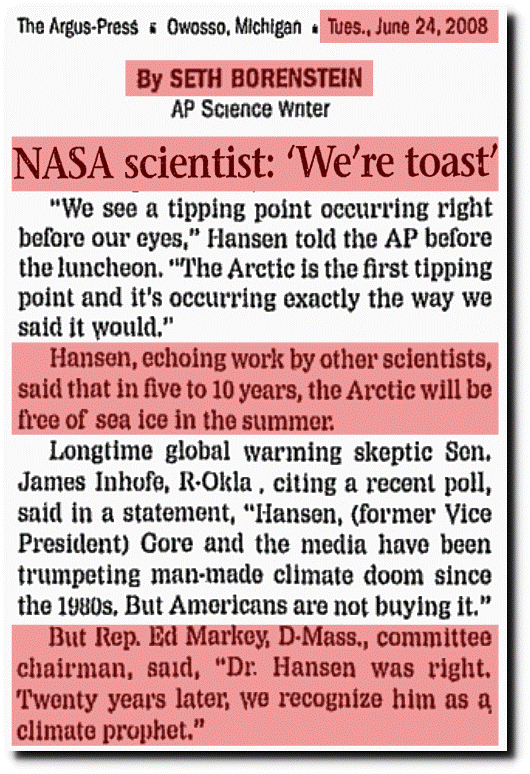
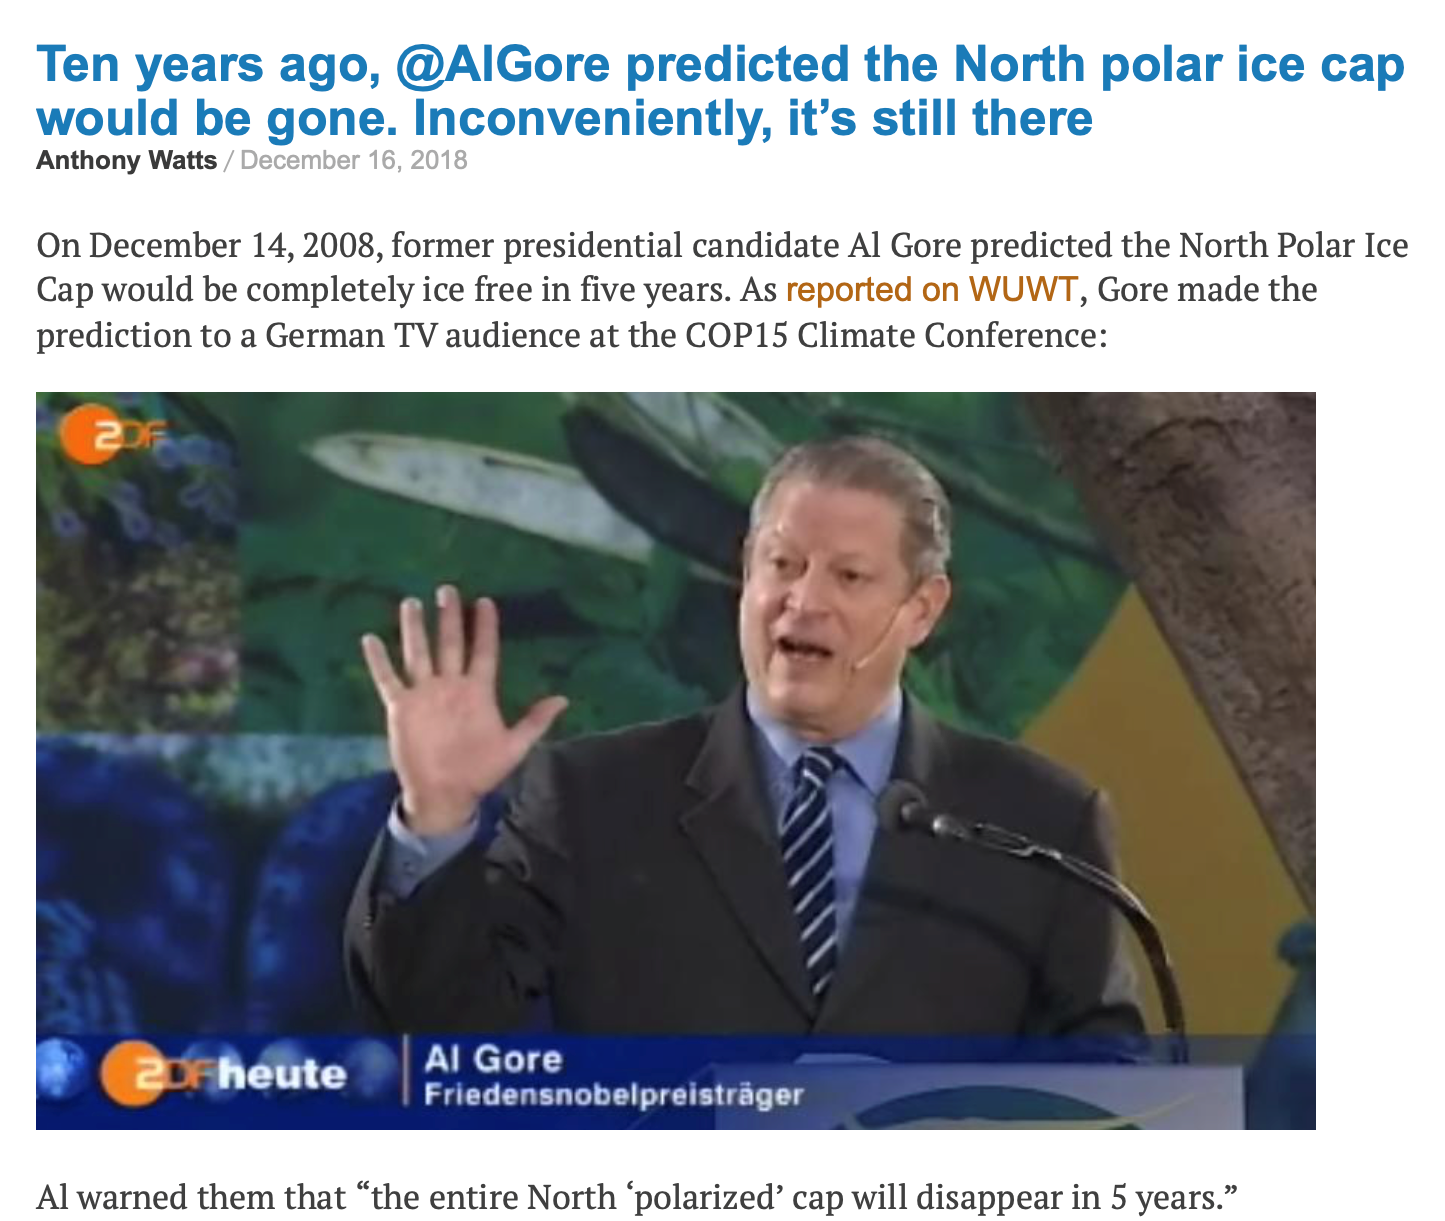
Modern doomsayers have been predicting climate and environmental disaster since the 1960s. They continue to do so today.
None of the apocalyptic predictions with due dates as of today have come true.
What follows is a collection of notably wild predictions from notable people in government and science.
More than merely spotlighting the failed predictions, this collection shows that the makers of failed apocalyptic predictions often are individuals holding respected positions in government and science.
While such predictions have been and continue to be enthusiastically reported by a media eager for sensational headlines, the failures are typically not revisited.
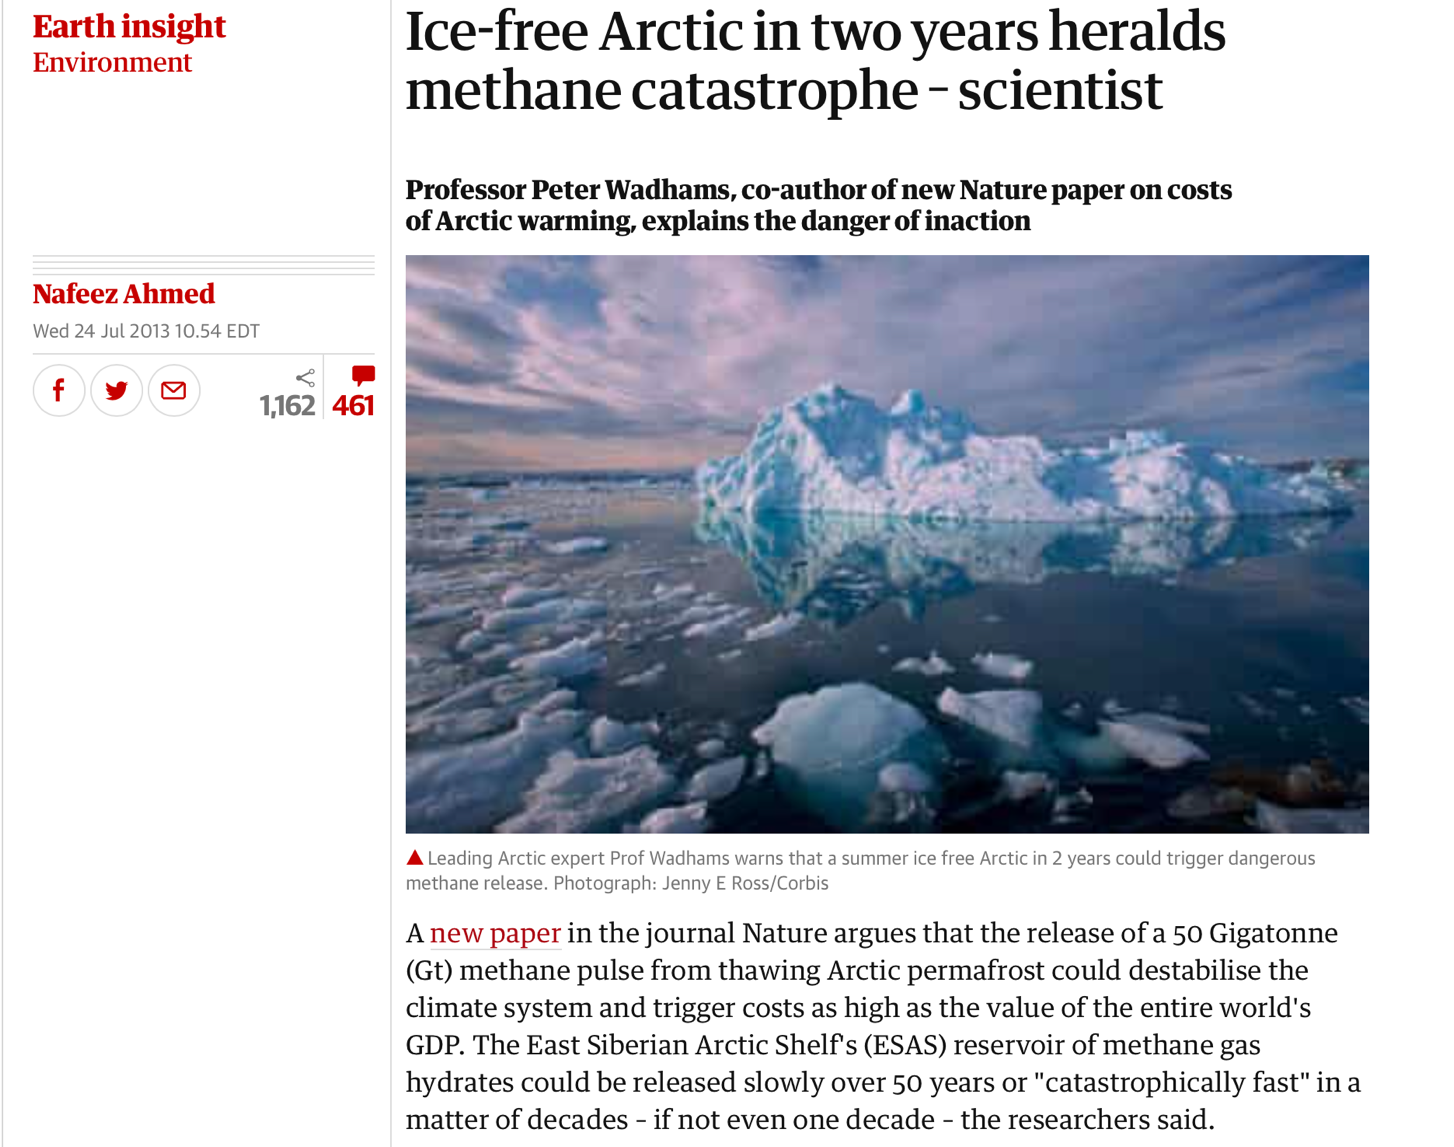
Source: The Guardian, July 24, 2013
The paper: https://www.nature.com/articles/s41467-017-02550-9 (open access) Gas hydrate dissociation off Svalbard induced by isostatic rebound rather than global warming
Abstract
Methane seepage from the upper continental slopes of Western Svalbard has previously been attributed to gas hydrate dissociation induced by anthropogenic warming of ambient bottom waters. Here we show that sediment cores drilled off Prins Karls Foreland contain freshwater from dissociating hydrates. However, our modeling indicates that the observed pore water freshening began around 8 ka BP when the rate of isostatic uplift outpaced eustatic sea-level rise. The resultant local shallowing and lowering of hydrostatic pressure forced gas hydrate dissociation and dissolved chloride depletions consistent with our geochemical analysis. Hence, we propose that hydrate dissociation was triggered by postglacial isostatic rebound rather than anthropogenic warming. Furthermore, we show that methane fluxes from dissociating hydrates were considerably smaller than present methane seepage rates implying that gas hydrates were not a major source of methane to the oceans, but rather acted as a dynamic seal, regulating methane release from deep geological reservoirs.
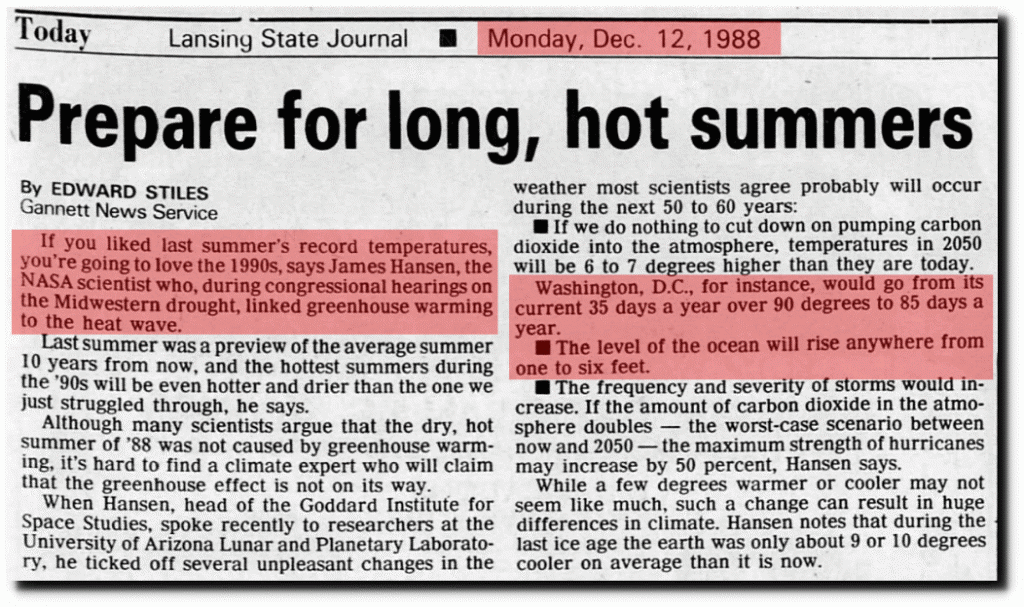
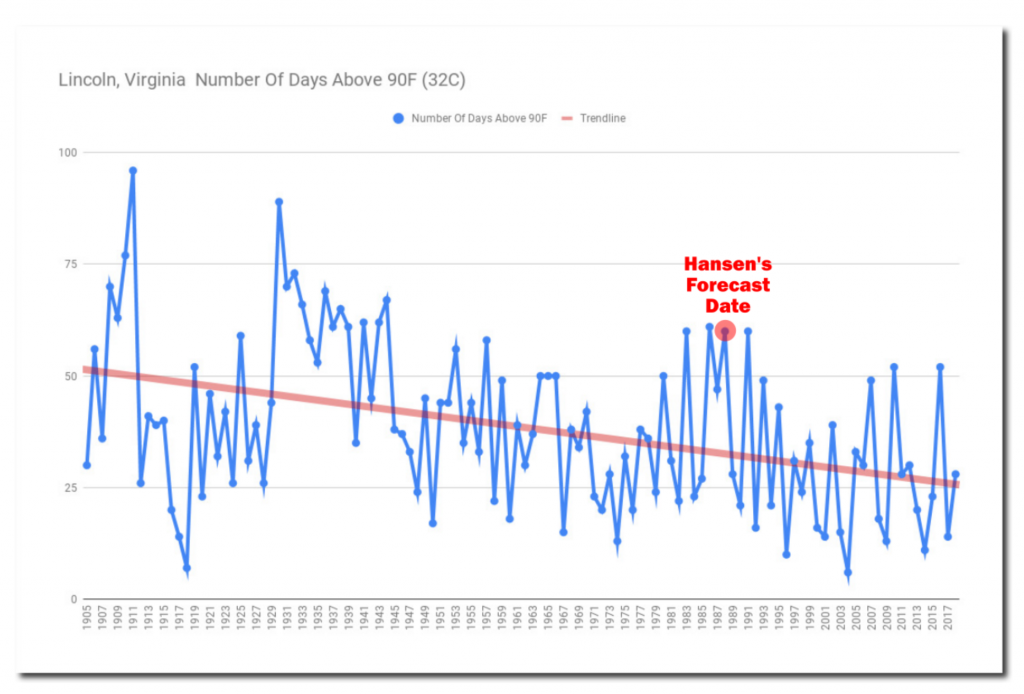
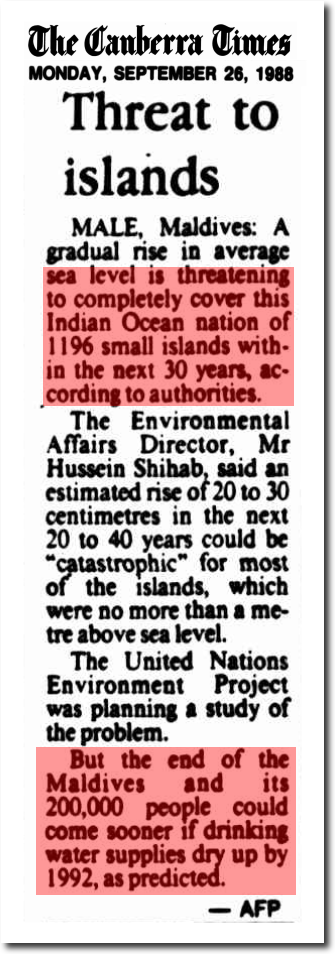
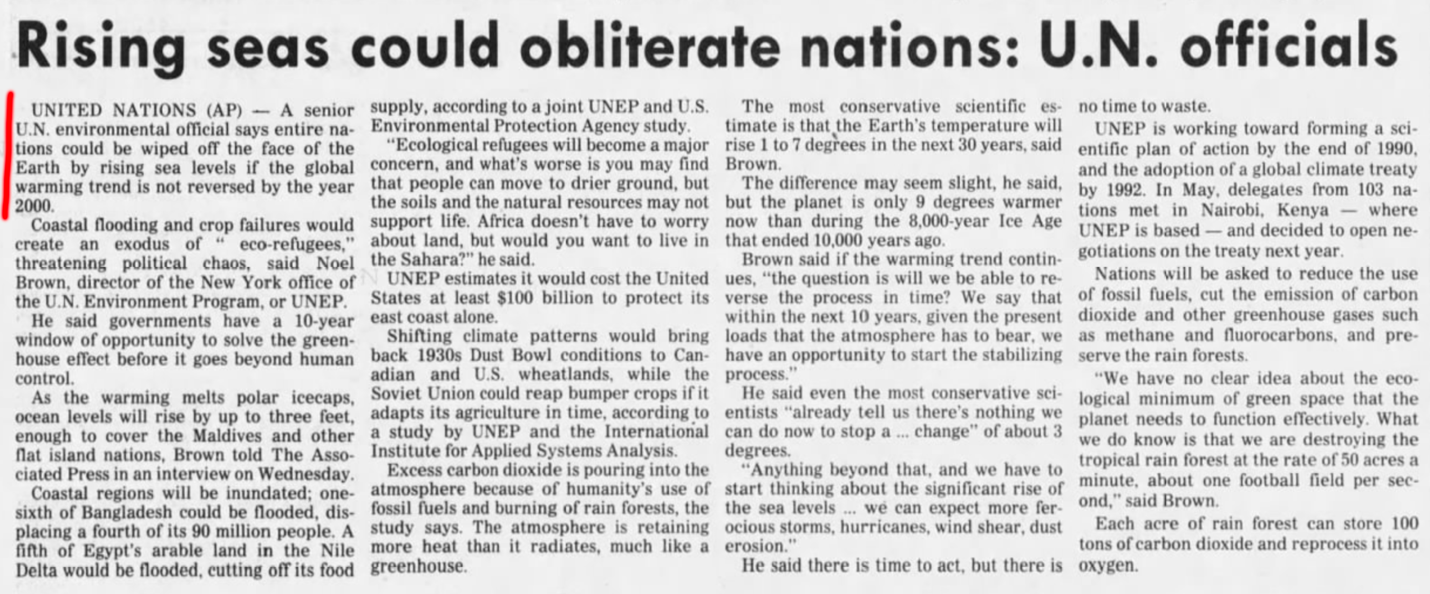
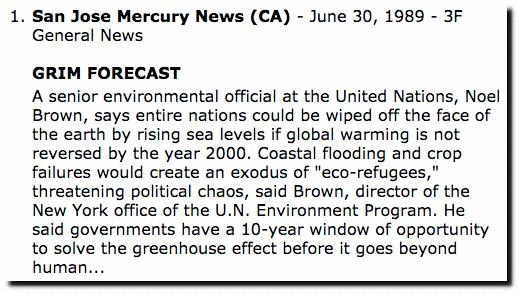
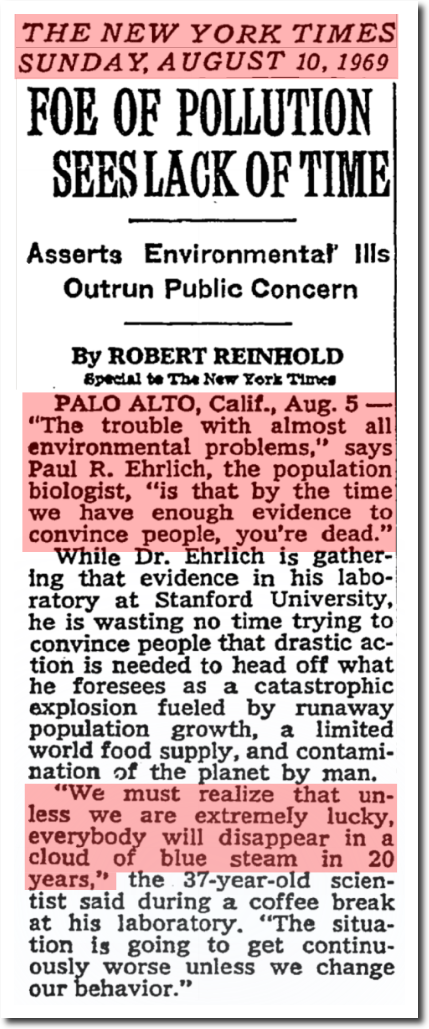
Prior to that, the most widely recognized academic expert predicted the end of the world by 1980.
A few days after we landed on the moon 50 years ago, Stanford professor Paul Ehrlich forecast that we would disappear in a cloud of blue steam within 20 years. Ehrich is John Holdren’s close associate, and Holdren was Obama’s science advisor.
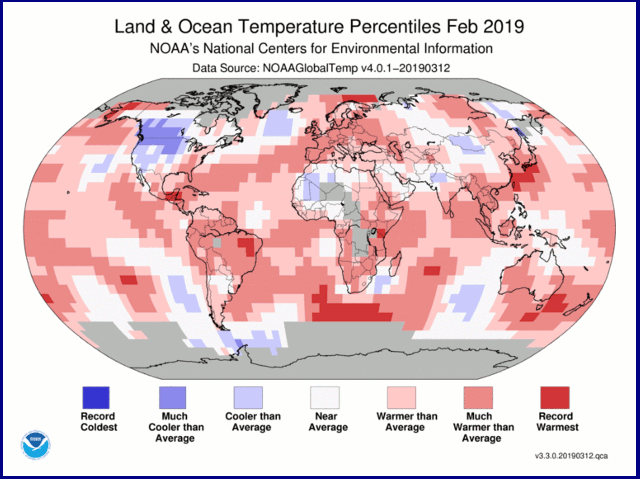
According to NCEI’s Regional Analysis, South America, Europe and Oceania had a February temperature that ranked among the eight warmest Februarys on record.
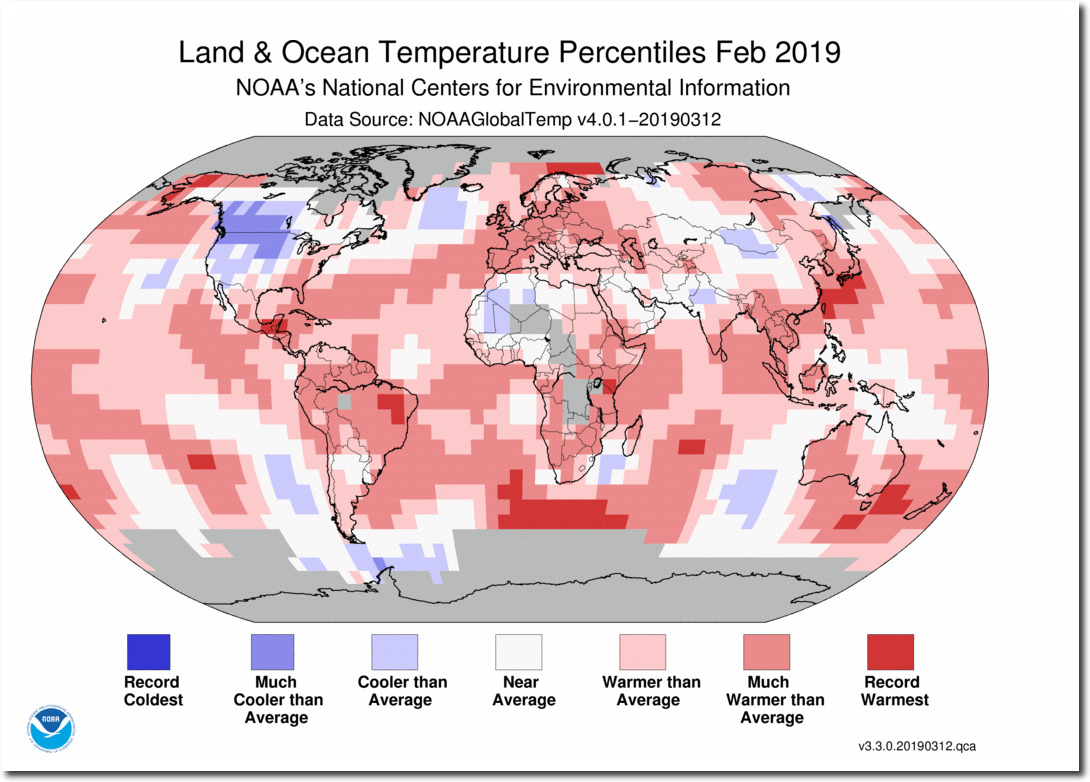
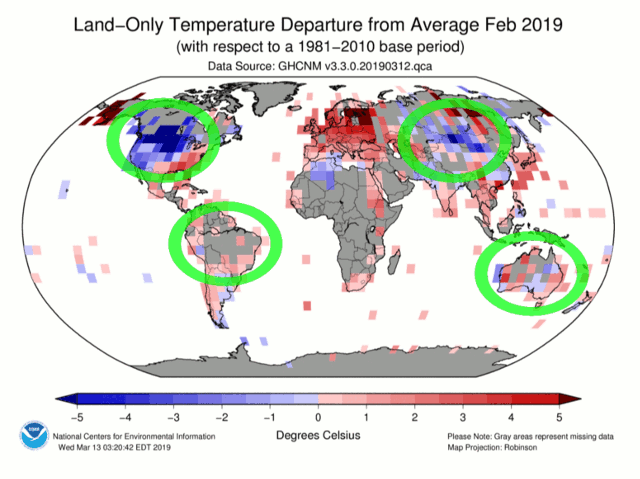
There is no such word as “Februarys” – plural for February is Februaries. But besides the fact they are illiterate, they are also lying. This is the map they use to justify their claims:
It looks like the world is burning up, with just a few slightly cool areas. It has an official government seal on it, so it must be accurate, right?
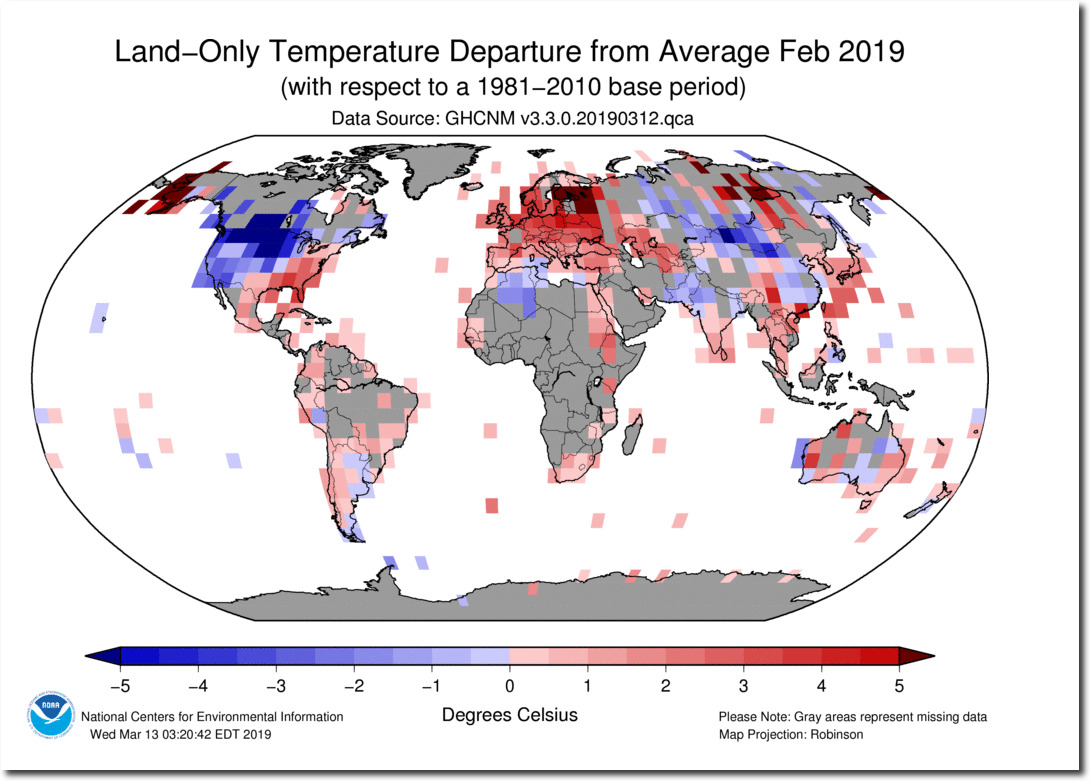
The map below shows where NOAA actually had surface temperatures in February.
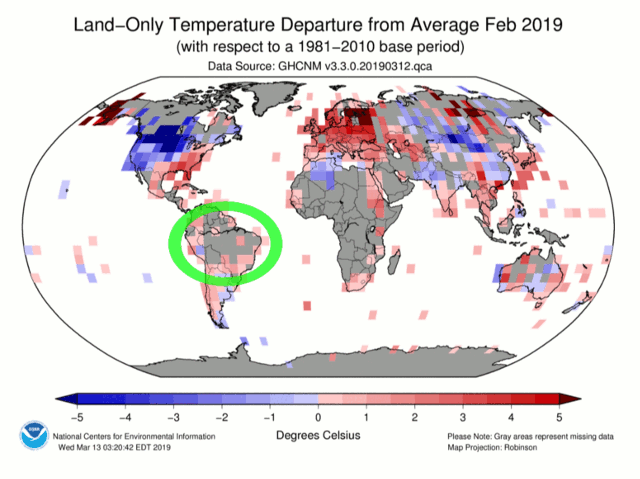
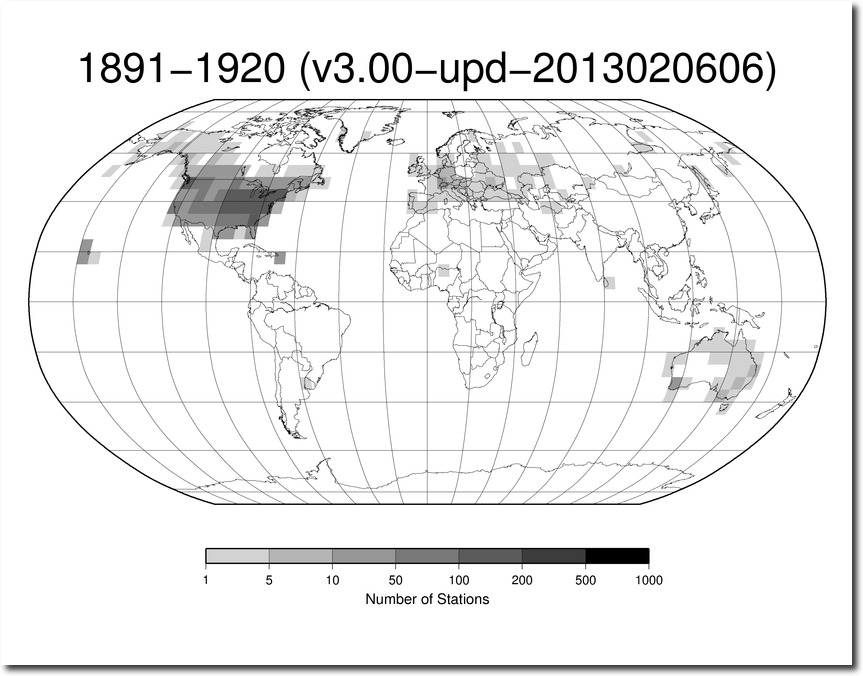
The map looks nothing like the one NOAA presents to the public. By pixel count, 51% of the land area is gray “missing data,” 16% is below normal temperature, and 33% is above normal. The animation below shows how they created one of the eight warmest “Februarys” in South America – by simply making up data, including record warmth in Brazil in locations with no actual thermometer data.
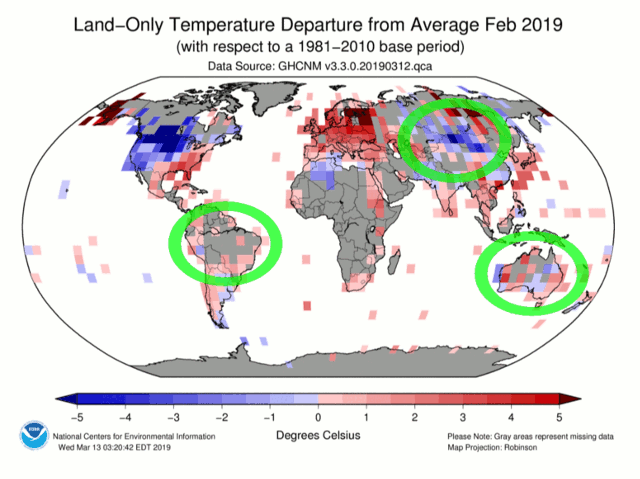
Also note how they made the cold in Asia and parts of Australia disappear.
And they largely made the near record cold in much of North America disappear.
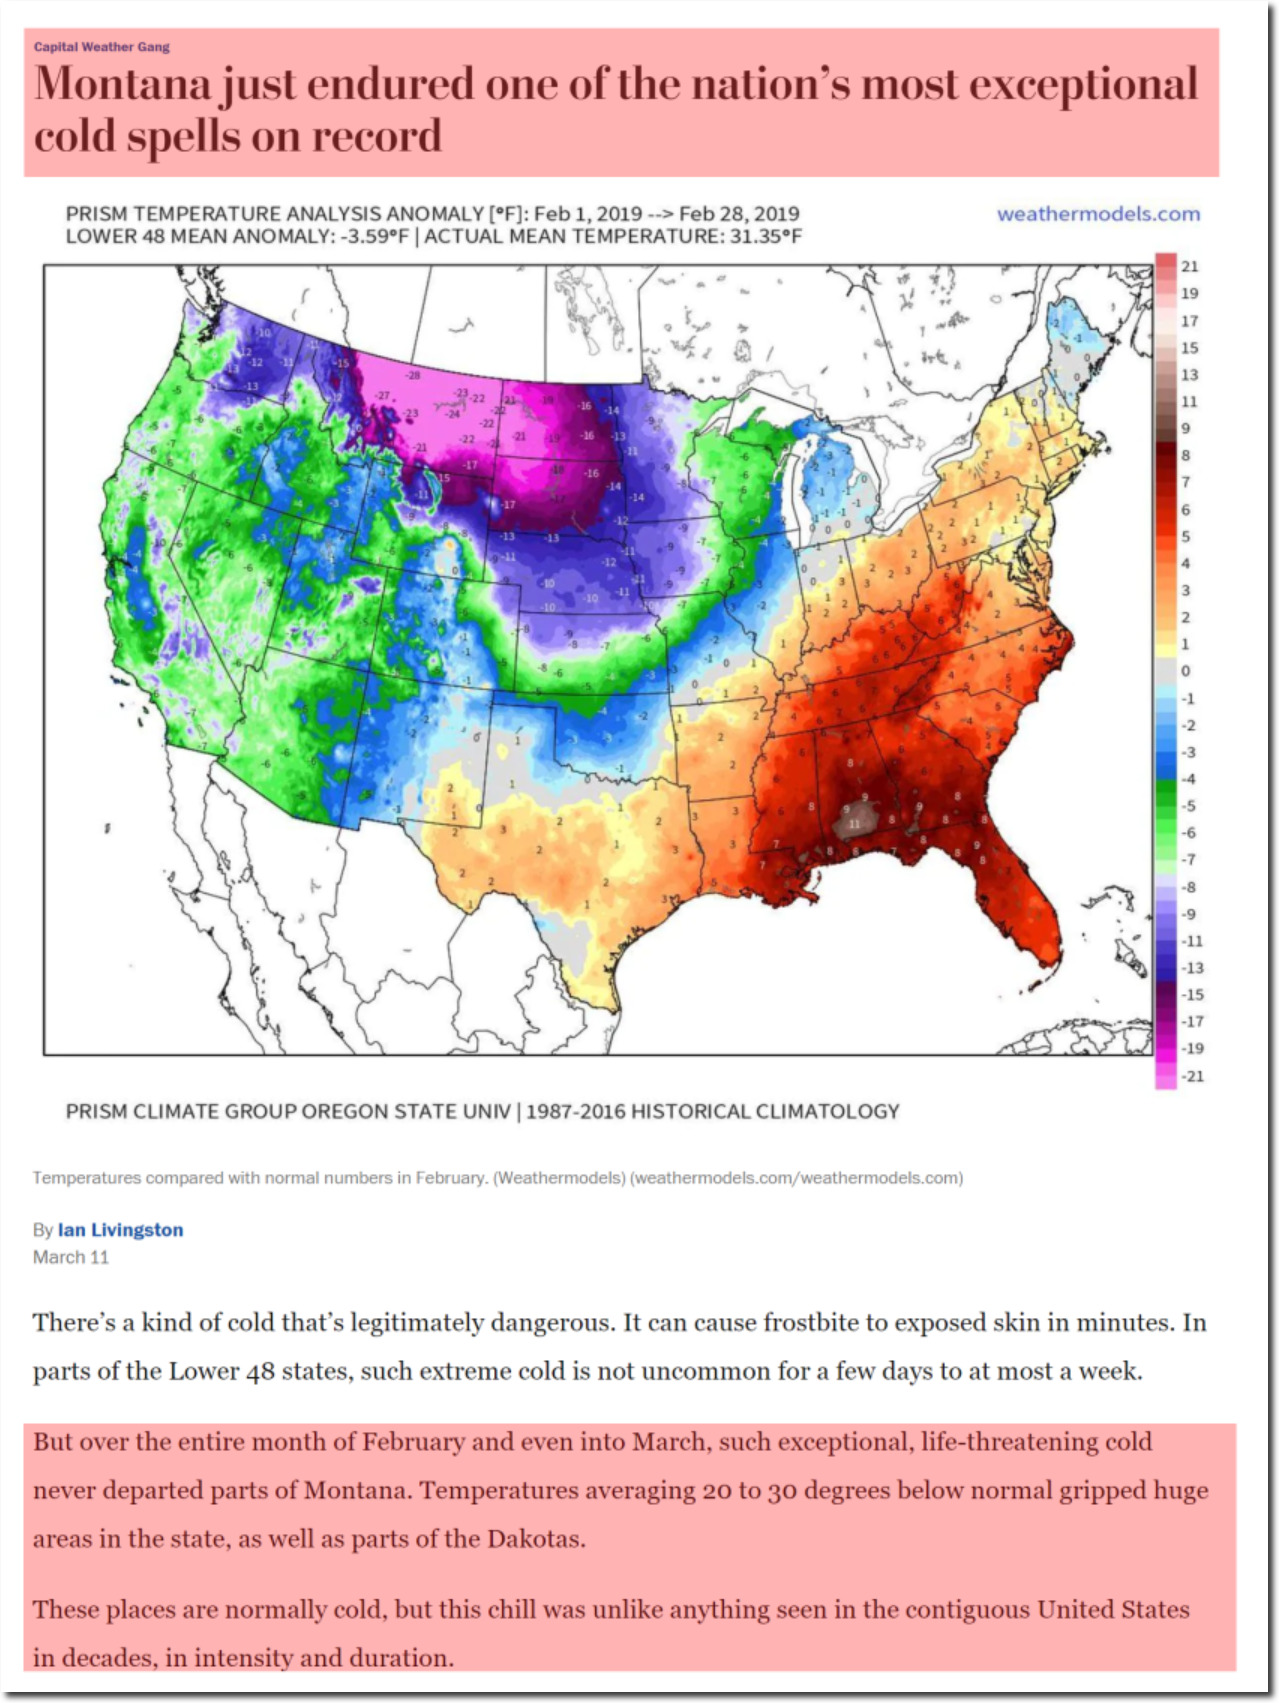
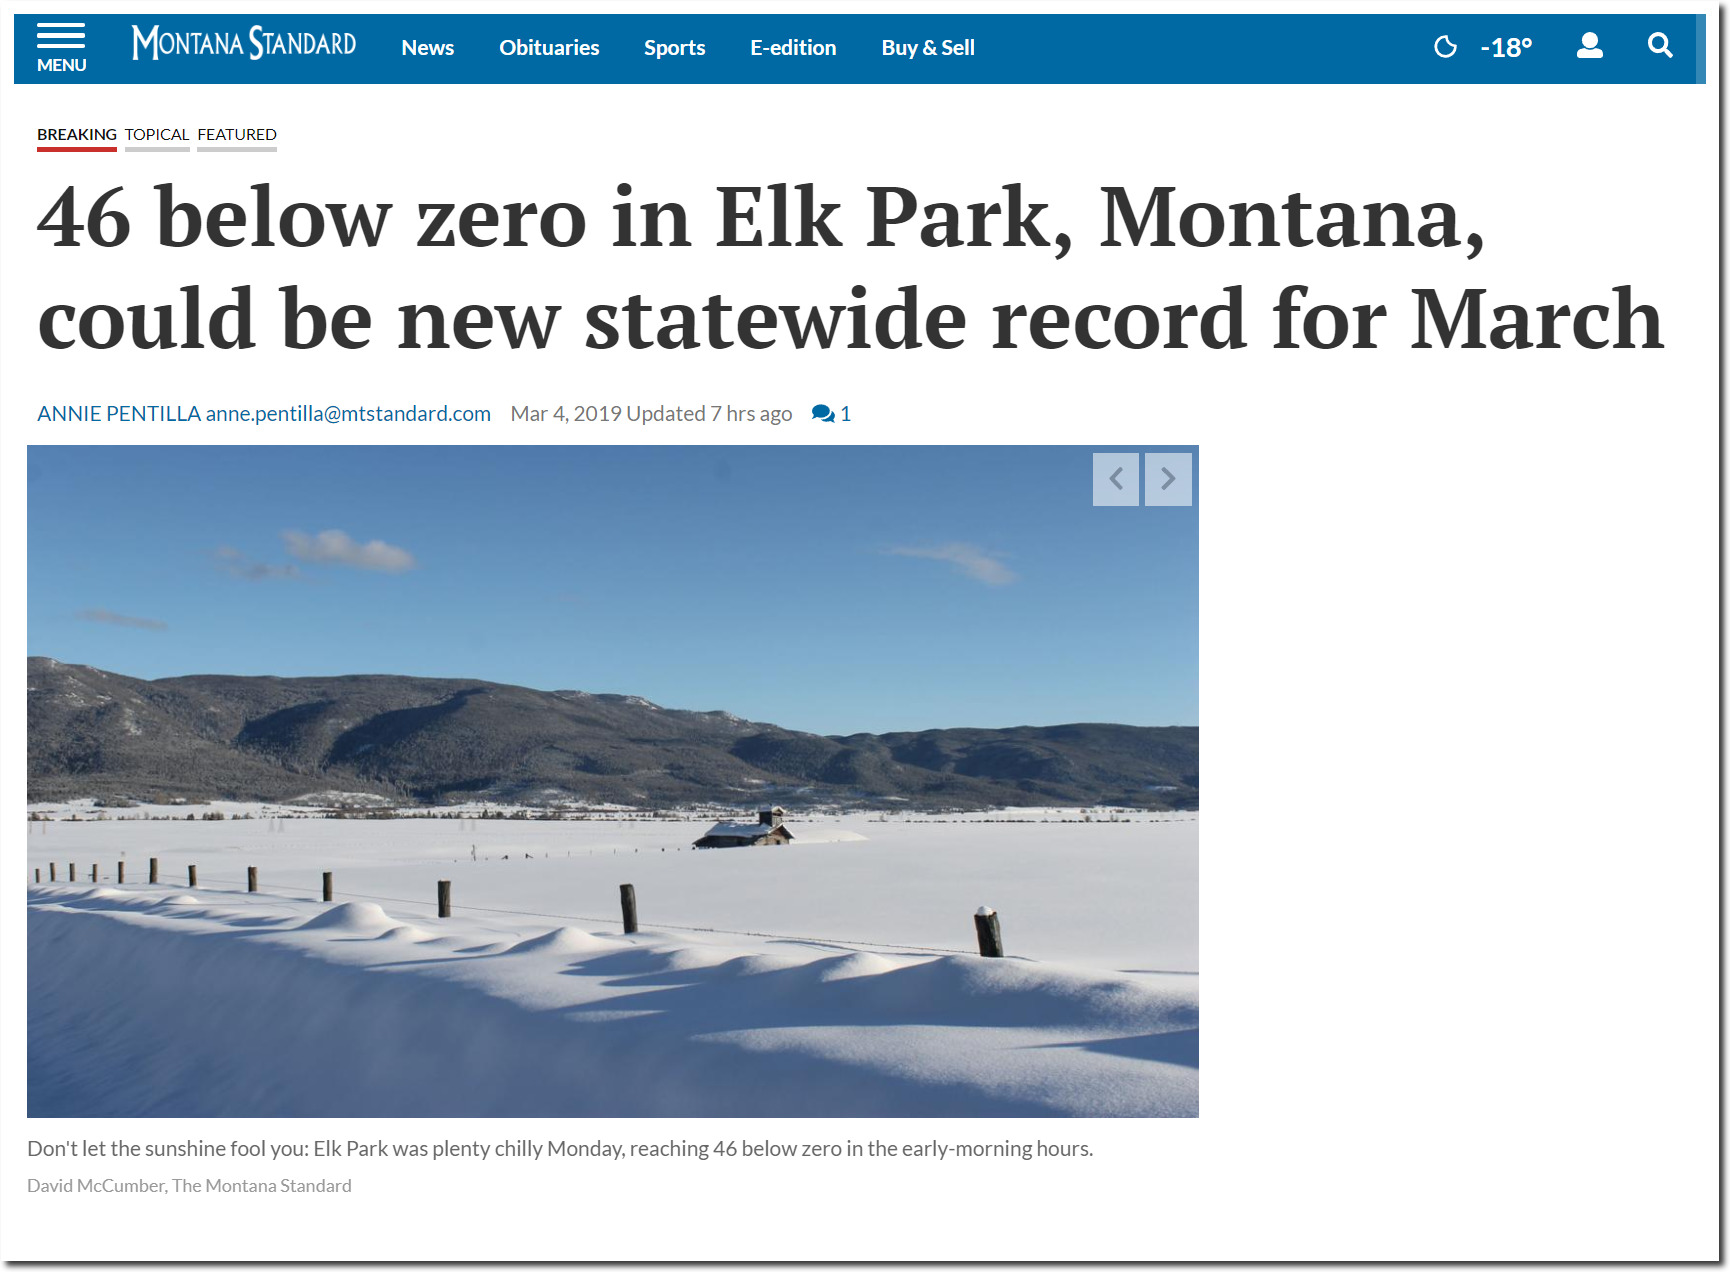
Montana and the Dakotas were 20 degrees below normal, as was much of Canada. Here is how the Washington Post described it:
The February temperature departures from normal were stunning. Several major climate locations averaged 27 to 28 degrees below normal, the most extreme departures in the Lower 48 for a full month since January 1969
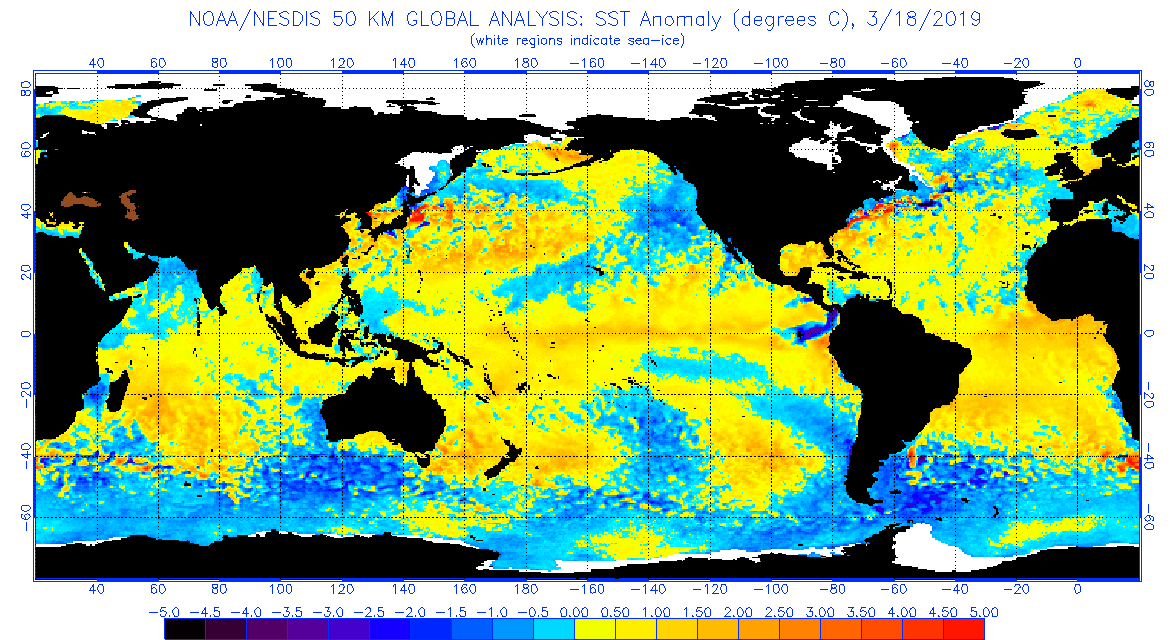
The NOAA land data is fake, and an Orwellian rewrite of record cold at spots. But the ocean data is even faker.
the global ocean-only surface temperature was 0.70°C (1.26°F) above average and the second warmest February since global records began in 1880
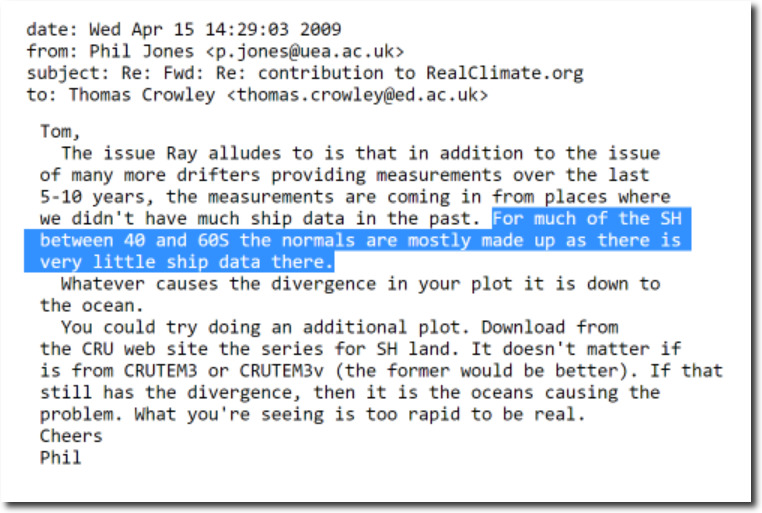
They claim to have ocean temperature records back to 1880 – which is patently false. Prior to about 15 years ago, no one even pretended to have pre-1950 global ocean data. And as Phil Jones at CRU said, much of the data they are using is “made up.”
For much of the SH between 40 and 60S the normals are mostly made up as there is very little ship data there.
The animation below flashes between the NOAA temperature departure map and the temperature percentile map. You can see how blues disappear, and pink turns to red.
The next step of the process is generation of propaganda like this:
I honed in on my location (Dulles, VA). We were +2 for February – you’d think that would be considered “near normal” but it got the light pink shade. Technically I guess its correct but it’s very deceptive.
they’re reaching desperation level because every year the gap between the temperatures they need and the reality on the ground grows wider. eventually it will become binary and people will be told it never snowed despite record sales of snow shovels and salt. We just came off a phenomenally cold and snowy february in SW WI yet somehow their graph shows us close to average. we rarely got to within 15 degrees (F) of average daily highs and lows.
This winter was so cold in the USA and many people were forced to pay too much money for heating or could not afford to do so- so they need this kind of propaganda to counterbalance reality. Therefore this summer will have the most records ever as they have a lot to “repair” inside people minds to keep the religion alive.
Just as islam is the religion of peace global Warming is everywhere – except there where you live.(and where data was not adjusted)
This morning’s paper ran a Seth Borentstein special, telling readers that the globe is warming because high temp records are running 2-to-1 ahead of cold temp records. His data had been checked by climate scientists, so it had a very truthy quality. He picked certain stations, might be a clue there, all it said was stations running since 1920 but didn’t say how the stations were selected. I’ll likely enjoy our host taking it apart.


so they need this kind of propaganda to counterbalance reality.
Therefore this summer will have the most records ever as they have a lot to “repair” inside people minds to keep the religion alive.
except there where you live.(and where data was not adjusted)